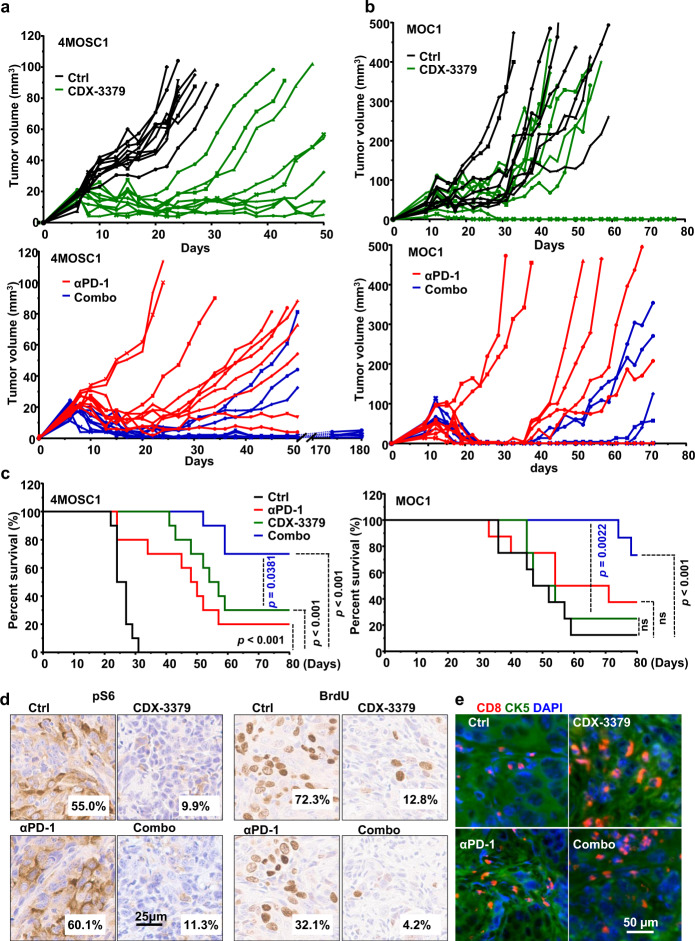
Fig. 6. Anti-tumor effect of HER3 inhibition in syngeneic HNSCC models and increased durable responses to PD-1 blockade.
a C57Bl/6 mice were implanted with 1 × 10⁶ of 4MOSC1 cells into the tongue. After tumors reached ~30 mm3, mice were treated IP with of isotype control, CDX-3379 (20 mg/kg), anti-PD-1 (10 mg/kg), or a combination of CDX-3379 and PD-1 three times per week for 3 weeks. Individual growth curves of 4MOSC1 tumor-bearing mice are shown (n = 10 per group). b C57Bl/6 mice were implanted with 2 × 10⁶ MOC1 cells into the flanks. After tumors reached approximate 50 mm3, mice were treated same as panel (a). Individual growth curves of MOC1 tumor-bearing mice are shown (n = 8 per group). c A Kaplan–Meier curve showing the survival of mice from panels (a) and (b). The death of animals occurred either naturally, when tumor compromised the animal welfare, when tongue tumor volume (panel a) reached 100 mm3 (n = 10 mice per group), or when flank tumor volume (panel b) reached 500 mm3 (n = 8 mice per group). Two sided log-rank/Mantel–Cox test. d Representative immunohistochemical analysis of pS6 and BrdU in the short-term treatment groups (every other day for three treatments) from panel (a). Brown chromogen deposition reflects the immunoreactivity; hematoxylin was used as a nuclear counterstain (blue). Scale bars represent 25 μm. Quantification from images on the left using Qupath software and the percentage of positive staining are shown on each image. e Immunofluorescent staining of CD8 and CK5 in the short-term treatment from panel (a). Source data are provided as a Source Data file.

