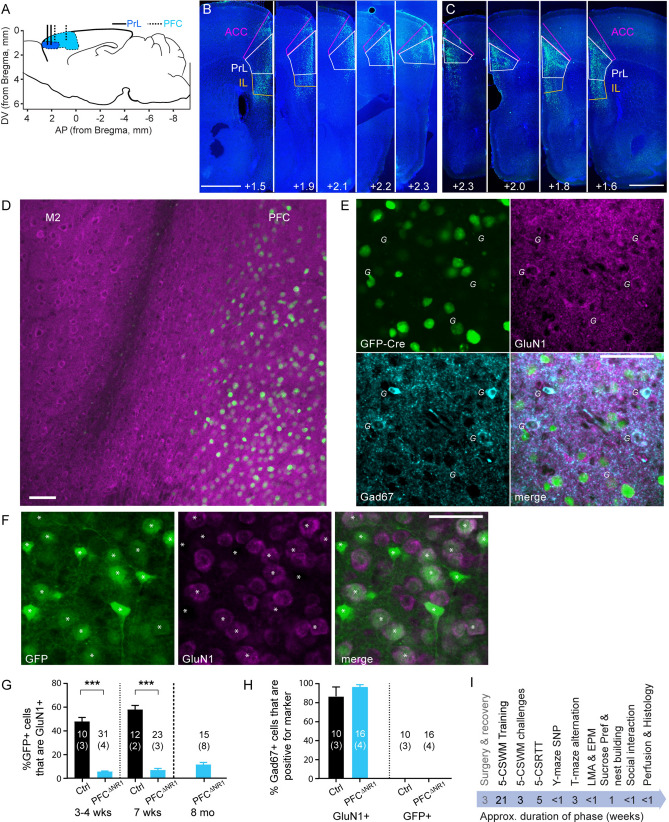
Figure 1.
Virally mediated NMDAR ablation. (A) Illustration of target region of the medial PFC (blue), with the PrL region in darker shade of blue, in a saggital cut through the mouse brain. Vertical lines indicate infusion sites for broader (dotted, dorsal PFC) and more narrow (solid, PrL) targeting. (B, C) Examples of staggered coronal slices of a mouse brain transfected with rAAV8-CamKII-GFP-Cre (green) either with broader (B) or more narrow (C) targeting (see Methods). Blue, DAPI-stain; green, native GFP-fluorescence. Scale bar, 1 mm. Numbers state the distance from Bregma (as shown in A). (D) Microscopic image showing expression of GFP (green) and GluN1 (magenta) of a brain slice (at the PFC/M2 border) of an fGrin1 mouse brain slice transfected with a GFP-Cre vector; note the ample expression of GluN1-positive cells outside the transfected region. (E) Closer view onto a section of GFP-Cre-transfected (green) PFC double-stained against GluN1 (magenta) and Gad67 (cyan). Italic G are placed to the bottom left of Gad67-positive cells. (F) Section of a PFC of a GFP-transfected control mouse, stained against GluN1. Note that GFP-expression from the control vector is cytosolic (F), but GFP is localized to the nucleus if fused to Cre (E). GFP-positive cells are labelled by white asterisks. Scale bar, 50 m (D-F). (G) Bar-graphs showing average share of GFP-positive cells that were also positive for GluN1 in the indicated groups and at the stated time-points after transfection. (H) Average share of Gad67-positive cells that were also positive for GluN1 (left) or GFP (right) in the indicated groups (the time points 3–4 wks and 7 wks after transfection were merged for this analysis; no Gad67-positive cells were GFP-positive). Stated N-numbers in each bar of (G-H) refer to analysed fields of view (top) obtained from the number of mice stated in brackets below. ***P < 0.001, MWU-test. (I) Order and approximate duration of behavioural assays (black) conducted in this study after the initial surgery (grey).

