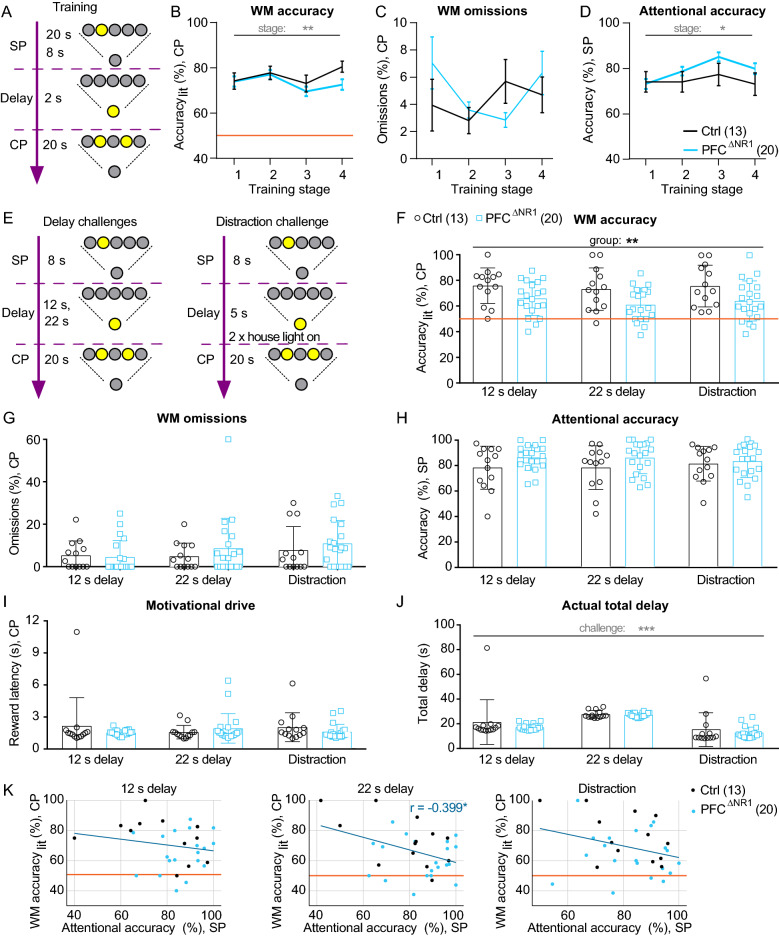
Figure 2.
Training and behavioural challenges in the DMTP 5-CSWM task. (A) Simplified scheme of the 5-CSWM operant DMTP assay as conducted during the training stages 1–4 (see Supplementary Fig. 1 for details). (B-D) Average performance on the last 3 d of each of the four training stages for the primary WM indicator accuracylit measured in the CP (B), an indicator of task engagement, % omissions in the CP (C), and the primary attention indicator accuracy measured in the SP (D). See Supplementary Fig. 1 for details on stage parameters, further performance indicators for these sessions and the averages of the first 3 sessions on each stage, and for statistical details on RM-ANOVAs for all assessed parameters. (E) Illustration of the applied delay and distraction challenges. (F–J) Average performance and control parameters across the three challenge conditions (data from the first challenge day each conducted immediately after a day with training in the baseline stage) showing the primary WM indicator CP accuracylit (F), % omissions in the CP (G), attentional SP accuracy (H), CP reward latency as a metric for motivational drive (I), and the true total delay (J). See Supplementary Fig. 2 for further performance indicators. Statistical indicators in every data panel relate to RM-ANOVA across indicated protocols and groups, stating effects of protocol (grey) or group (black); no significant group-protocol interactions were found. (K) Scatter plots of WM accuracylit (CP) and attentional accuracy in the corresponding SP for all three WM challenges (named above each sub-panel); individual dots represent animals, colour-coded by group; dark blue line represents linear fit across all animals. A significant negative correlation (r) was found in the 22 s delay challenge (middle), if including all animals—but not for the KO-group alone. See Supplementary Table 2 for statistical details on RM-ANOVAs for all assessed parameters, and Supplementary Table 3 for additional ANCOVAs and correlation analysis (relating to K) exploring dependencies between WM accuracy and attentional accuracy. The legends in (D) and (F) indicate the colour-code and size of each group. Orange lines (B, F) represent chance-level performance. *P < 0.05, **P < 0.01, ***P < 0.001. Error bars, s.e.m. (B–D) or S.D. (F–J).

