Figure 5.
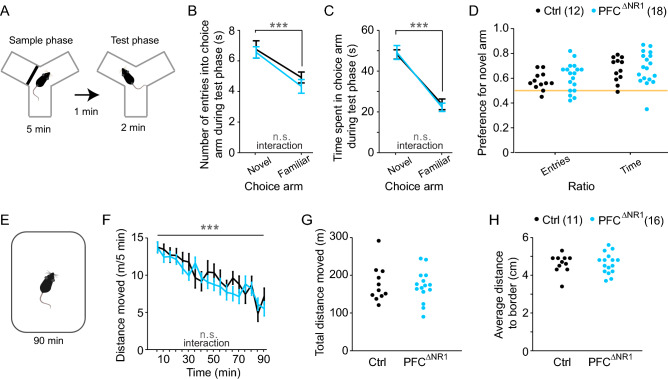
Assessment of spatial short-term habituation. (A) Illustration of the spatial novelty-preference test which consists of a 5 min sample phase, a 1 min ITI, and a 2 min test phase. (B, C) Number of entries (B) and time spent (C) in the novel and familiar choice arms during the test phase. Grey indicators, effect of arm and group-arm interaction in overall RM-ANOVA. (D) Preference ratios for the novel arm calculated based on the data in (B) and (C). (E) Illustration of novelty-induced hyperlocomotion test. (F) Locomotor activity measured in moved distance in 5 min intervals over the 90 min of the test. Grey indicators, effect of time bin and group-time interaction in overall RM-ANOVA. (G) Total locomotor activity over 90 min of individual mice (dots, colour-coded as in (F)). (H) Same display as in (G) but for the average distance to the border of the open field over 90 min as a proxy for anxiety. No effects of group were found (RM-ANOVA, B, C, F; t-test, D, G, H). The legend indicates the colour-code and size of each group. See also Supplementary Table 4 for all related statistics. n.s., P > 0.1, ***P < 0.001. Error bars, s.e.m.

