Figure 6.
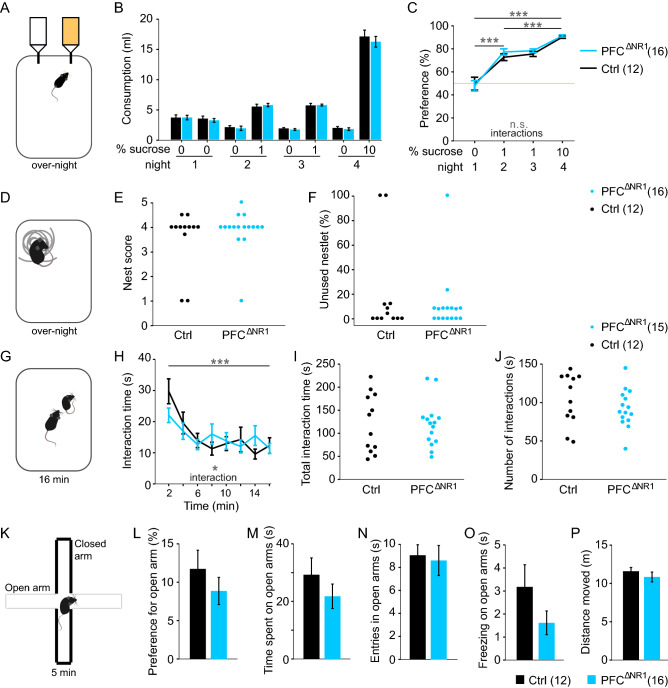
Assessment of social and emotional functioning. (A) Illustration of sucrose preference test conducted over-night while animals are single-housed. (B) Consumption of drinking water from each of the two bottles containing the stated concentration of sucrose across 4 nights. (C) Same data as in (B) but expressed as sucrose preference ratio (100*volume of water consumed from the designated sucrose-bottle/total water consumption) in %. Orange line shows chance level. Statistical indicators refer to RM ANOVA across the indicated nights and the two groups; there were no significant effects of groups or interactions. (D) Illustration of the nest building test. (E, F) Dot-graphs displaying the nest score and relative amount of unused nestlet (intact bits of nestlet heavier than 0.1 g) for each mouse. Analysis with MWU-test revealed no significant effect of group. (G) Assay of reciprocal social interaction in a novel open field. (H) Time spent in active social interactions in 2 min intervals over the 16 min test. Grey indicators, effect of time bin and group-time interaction in overall RM-ANOVA; no effect of group was found. (I, J) Dot-graphs displaying the total time (I) and number (J) of interactions made during the complete test; no effect of group was found (t-test). (K) Illustration of the elevated plus-maze with two open arms (grey) and two closed arms (black). (L) Preference to spent time on the open arm relative to the time in closed arms. (M) Total time spent on open arms, during the 5 min test. (N) Total entries into any of the open arms. (O) Total time spent freezing on the open arm. (P) Total distance moved during the test. No effect of group was found (t-test). The legends indicate the colour-code and size of each group for every experiment. See also Supplementary Table 4 for all related statistics. n.s., P > 0.1, *P < 0.05, ***P < 0.001. Error bars, s.e.m.

