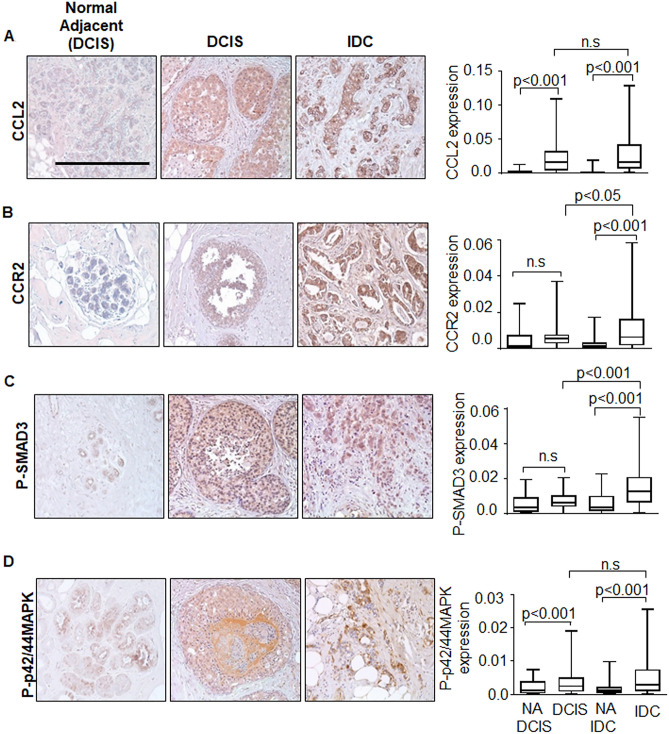
Figure 1.
Expression of CCL2/CCR2 related signaling proteins are elevated in DCIS and further upregulated in IDC patient tissues. TMAs containing DCIS (n = 72), IDC (n = 74) or normal adjacent breast tissues to DCIS (NA DCIS) (n = 25) or to IDC (NA IDC) (n = 61) were immunostained with antibodies to: (A) CCL2, (B) CCR2, (C) phospho-SMAD3 or (D) phospho-p42/44MAPK. Scale bar = 200 microns. Immunostaining was quantified by Image J. Whisker box plots are shown. Whiskers indicate min and max values. Box indicates upper and lower quartile range. Line indicates median. Statistical analysis for DCIS vs. IDC was performed using Mann–Whitney–Wilcoxon Test. Statistical analyses for NA DCIS vs. DCIS and NA IDC vs. IDC were performed using Wilcoxon Signed Rank Test. Statistical significance analysis was determined by p < 0.05. ns not significant. Scale bar = 200 microns.

