Figure 2.
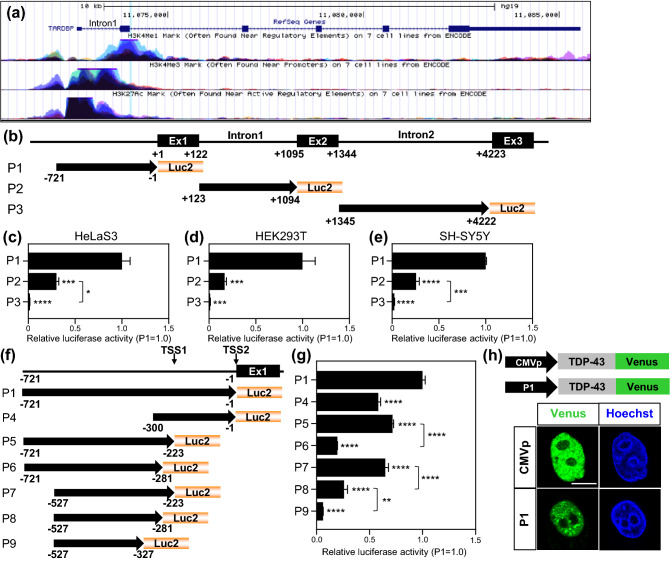
The TARDBP upstream region exhibits promoter activity. (a) Epigenetic marker activity in the human TARDBP region in 7 cell lines from ENCODE is exhibited by the UCSC genome browser. H3K4me1 (often found near regulatory elements), H3K4me3 (often found near promoters) and H3K27ac (often found near active regulatory elements) are described. The TARDBP genomic position is chr1:11072679–11085549 in GRCh37/hg19, and the gene accession code from NCBI is NM_007375. (b) Schematic representation of the TARDBP upstream promoter and intron/Luc2 constructs (P1–3). The black boxes and lines indicate exons (Ex) and introns, respectively. + 1 indicates TSS2 (see Fig. 1). P1 (− 721/− 1), P2 (+ 123/ + 1094, intron 1), and P3 (+ 1345/ + 4222, intron 2). (c–e) TARDBP promoter/luciferase assay in 3 cell lines: HeLaS3 (c), HEK293T (d) and SH-SY5Y (e). n = 3 replicates; one-way ANOVA with post hoc Tukey’s test relative to P1. (f) Schematic representation of TARDBP promoter constructs (P4–9). P4 (− 300/− 1), P5 (− 721/− 223), P6 (− 721/− 281), P7 (− 527/− 223), P8 (− 527/− 281), and P9 (− 527/− 327). (g) Luciferase assay of TARDBP promoter fragments. Quantitative analyses have n = 9 (P1), n = 6 (P7) and n = 3 (P4, P5, P6, P8 and P9) replicates. One-way ANOVA with post hoc Tukey’s test was used, and all error bars indicate the means ± SEMs. **P < 0.01, ***P < 0.001, ****P < 0.0001. (h) Fluorescence images of TDP-43-Venus (Green) expression driven by the CMV promoter (CMVp) or TARDBP upstream promoter (P1) in HeLaS3 cells. Nuclei were stained with Hoechst (blue). Scale bar 10 μm.

