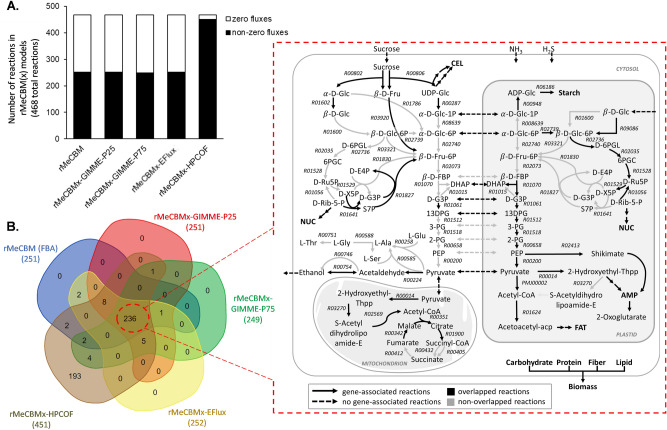
Figure 3.
Simulation of the transcriptome-integrated CBM models (rMeCBMx) constructed using GIMME, E-Flux and HPCOF algorithms, (A) the number of non-zero (active) and zero (inactive) flux reactions from rMeCBM, rMeCBMx-GIMME-P25, rMeCBMx-GIMME-P75, rMeCBMx-EFlux, and rMeCBMx-HPCOF and (B) commonly predicted active reactions from all models, 236 of 468 total reactions denoted in the overlapped region of the Venn diagram and depicted in the schematic pathway as black solid arrows, postulated to be core metabolic reactions basically driving carbon assimilation in developing storage roots of cassava. Gray arrows denote trivial reactions obtained from some model predictions. The solid and dotted arrows represent genes associated with the reactions.

