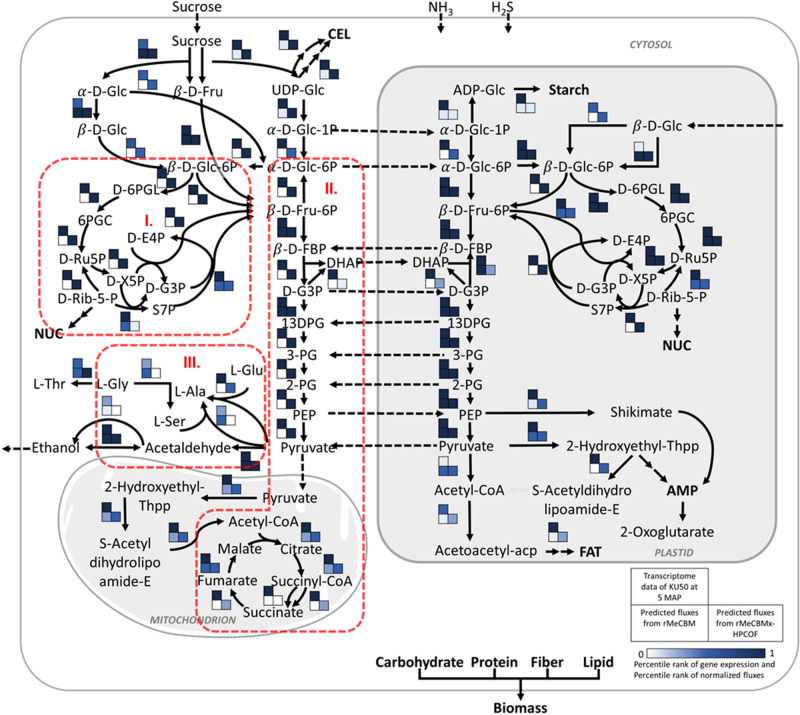
Figure 6.
The comparison of ranked gene expression levels (top cell) with ranked fluxes from rMeCBM (left bottom cell) and rMeCBMx-HPCOF (right bottom cell) as shown in the heatmap; the color represents relative levels of gene expression and fluxes with a score of 0–1. The improvement of rMeCBMx-HPCOF prediction is linked to (I) carbon substrates supply via pentose phosphate pathway, (II) TCA cycle and glycolysis, (III) carbon precursors for alanine biosynthesis.

