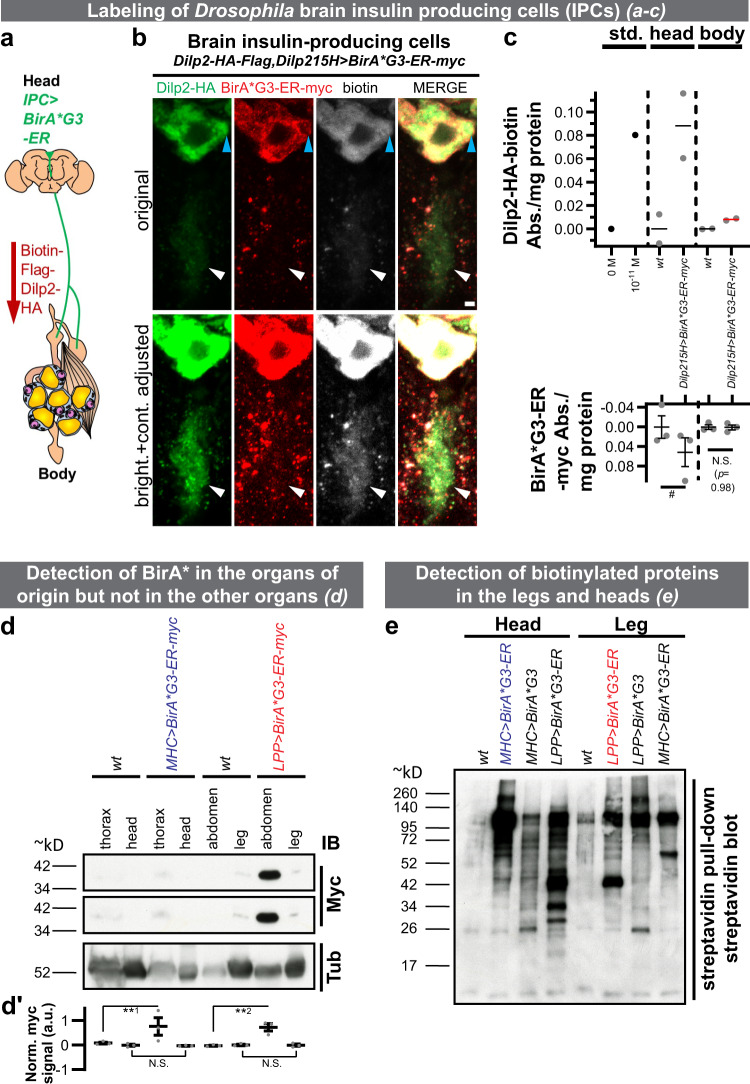
Fig. 1. Labeling of secreted proteins and their detection in distal organs.
a Schematic of the biotinylated Drosophila insulin-like peptide 2 (Dilp2) experiment. BirA*G3-ER (endoplasmic reticulum) was expressed in the insulin-producing cells (IPCs). b BirA*G3-ER+ (red), Biotin+ (white), Dilp2-HA+ (green)11 cell bodies, and BirA*G3-ERnegative, biotin+ and Dilp2-HA+ parts of the cell body (blue arrowhead) and ventral projections (which include dendrites and axons, which extend further13; white arrowhead) were detected. Scale bar: 2 µm. c Spatially informed bead enzyme-linked immunosorbent assay (ELISA) of biotinylated Dilp2-HA trafficking from head. Data are mean ± SEM absorbance (Abs.). Top: n = 2 biological replicates. Std. means standard peptide (1.04 × 10⁻¹¹ M standard biotin-Flag-GS-HA peptide (n = 1)). The mean of Dilp215H>BirA*G3-ER-myc body is shown with the red line. Bottom: n = 3 biological replicates; two-tailed t-test (#p = 0.08996). N.S. means not significant. Approximate locations of IPC axonal projections in the cartoon diagram are based on ref. 14. d Fat body (FB)-expressed LPP-Gal4>BirA*G3-ER-myc is detected in abdomens but not legs, and muscle-expressed MHC-Gal4>BirA*G3-ER-myc is detected in thoraxes but not heads. Middle panel: higher exposure of the myc blot. IB: immunoblot. See Supplementary Fig. 2bb for the parts of legs used. For each slice, all lanes are from the same blot (see Source Data for uncropped blots). d′ Quantification of signals from n = 3 independent experiments. Statistics: mean ± SEM integrated density of myc signals, normalized to tubulin (Tub) staining; one-way ANOVA and Benjamini, Krieger, Yekutieli linear two-stage step-up FDR. **1p = 0.0038; **2p = 0.0035; N.S. (p = 0.51). e Streptavidin bead pulldown followed by streptavidin-HRP detection in the leg and head lysates after FB and muscle biotinylation using BirA*G3-ER or BirA*G3 (cytoplasmic/nuclear for unconventionally secreted proteins). All lanes are from the same blot (see Source Data for uncropped blots). Representative result of three western blots. In d, e MHC>BirA*G3-ER and LPP>BirA*G3-ER are shown in color for clarity. In b–e flies were maintained with 50 µM biotin in food during adulthood. wt means wild-type. See also: Supplementary Figs. 1–3. Source data are provided as a Source Data file.

