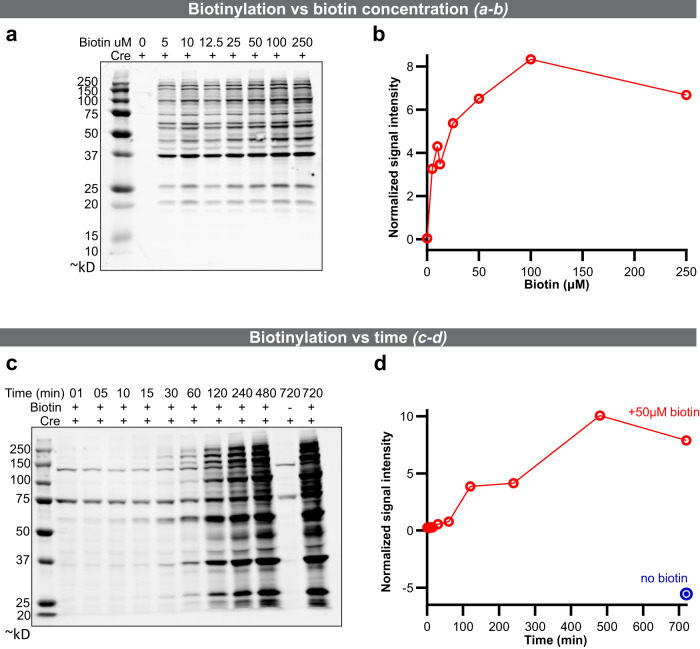
Fig. 5. Characterization of in vitro biotinylation in the BirA*G3–ER mouse embryonic stem cell (mESC) line.
a Western analysis of streptavidin binding to biotinylated proteins following 24 h of labeling at the indicated concentrations of biotin. All lanes are from the same blot (see Source Data for uncropped blots). b Quantification of biotin labeling relative to whole protein in a. c Western analysis of streptavidin binding to biotinylated proteins labeled in 50 μM biotin for the indicated times. All lanes are from the same blot (see Source Data for uncropped blots). d Quantification of biotin labeling relative to total protein in c. In this figure, representative results are shown from two western blots each. Source data are provided as a Source Data file.

