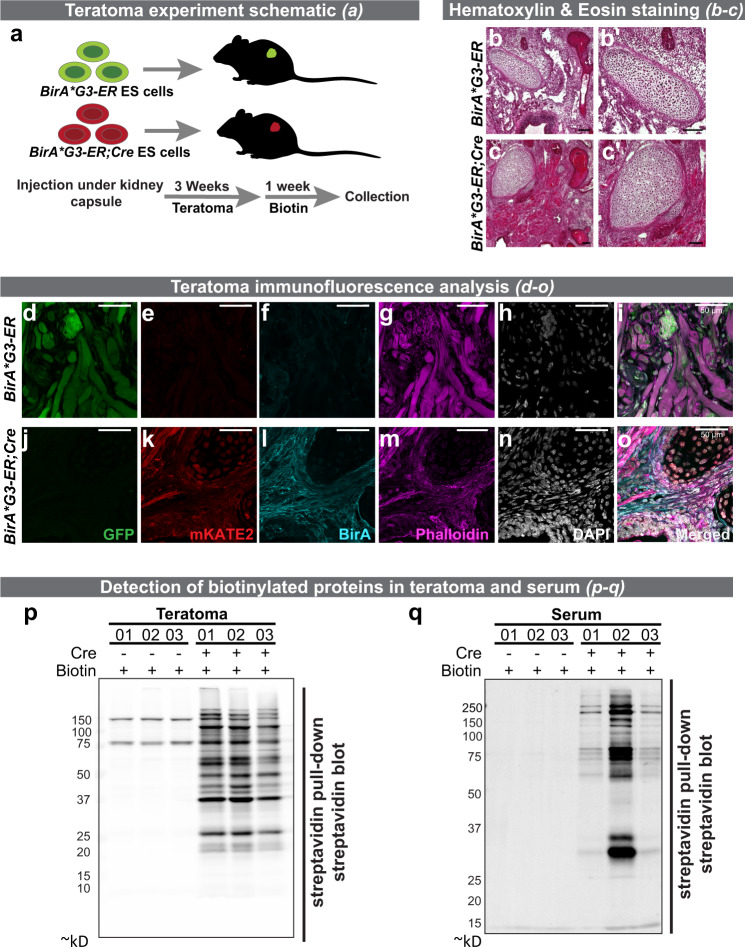
Fig. 6. Analysis of biotin labeling of proteins in vivo in a mouse embryonic stem cell (mESC)–derived teratoma model.
a Schematic representation of the teratoma study. GFP+ BirA*G3-ER mESC are shown in green, and mKate2+ BirA*G3-ER;Cre mESC are in red. b–c Hematoxylin and eosin staining of cryo-sectioned teratoma tissue. b′, c′ High magnification images. Representative results of three replicate images. Scale: 100 µm. d–o Analysis of reporter gene activity and BirA*G3 in cryo-sections of teratoma tissue. Scale bar: 50 µm. Green is GFP, red is mKate2, cyan is BirA, magenta is phalloidin, and white is DAPI. Representative images from 2 biological replicates with 2 sections per replicate. Another set of images was also acquired in testing the binding of antibodies. p–q Streptavidin labeling of biotinylated proteins from streptavidin pulldown of tumor (p) and serum samples (q). Note: the stronger signal in sample 2 in q reflects the significantly larger tumor mass in this individual. Representative results from six (p) and four (q) western blots. For each image, all lanes are from the same blot (see Source Data for uncropped western blots). See also: Supplementary Figs. 12 and 13. Source data are provided as a Source Data file.

