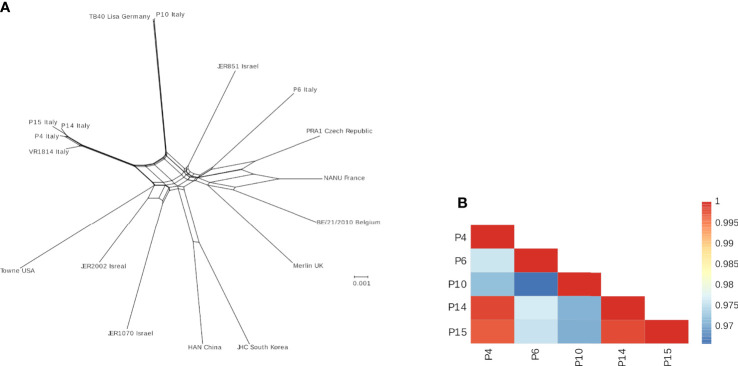
Figure 3.
(A) Neighbor-net split network of the five HCMV isolates plus additional genomes sequences. The geographic location where each sample was isolated is indicated. (B) Color-coded pairwise identity matrix for the five isolates. Each cell represents the percentage identity score between two sequences (indicated horizontally and vertically). The legend indicates the correspondence between pairwise identities and the color code. Identity scores were computed over all positions where gaps are not observed in either sequence.

