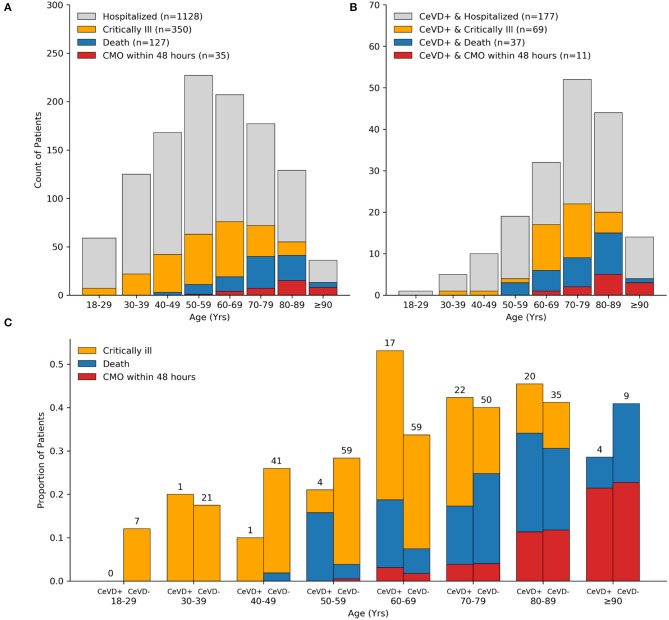
Figure 2.
Distribution of COVID-19 severe outcomes by cerebrovascular disease history. Bar plots showing counts of all hospitalized patients (A) and cerebrovascular disease subset (B) with the indicated COVID-19 outcome stratified by decade of life. The majority of critically ill patients over age 70 years and 100% of patients age 90 years old or older died within 28 days of admission. Age distribution of patients with cerebrovascular disease and COVID-19 was left-skewed compared to the total cohort. Bar plots showing the proportion of critically ill patients who died stratified by cerebrovascular disease status and decade of life. Counts (top of bars) show the number of critically ill patients in respective age groups and cerebrovascular disease status (C). CeVD, cerebrovascular disease; CMO, comfort measures only.

