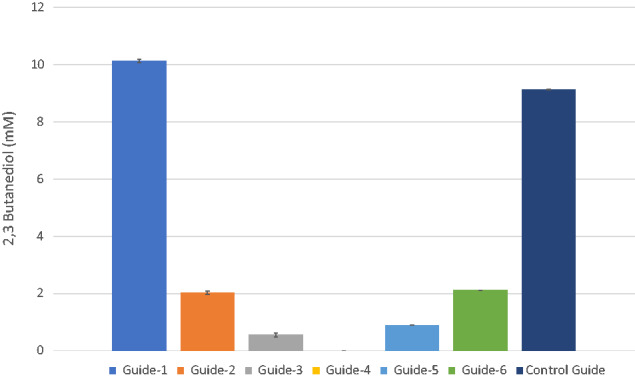
Figure 2.

Production of 2,3-butanediol by CAETHG_2932 KD cultures. Data shown are from endpoint samples taken after cultures had sustained lag-phase. CAETGH_0533-Guide-4 was used as a control guide. Data represented as bar graphs are average of biological replicates (N = 3), where error bars represent standard deviation.
