Figure 4.

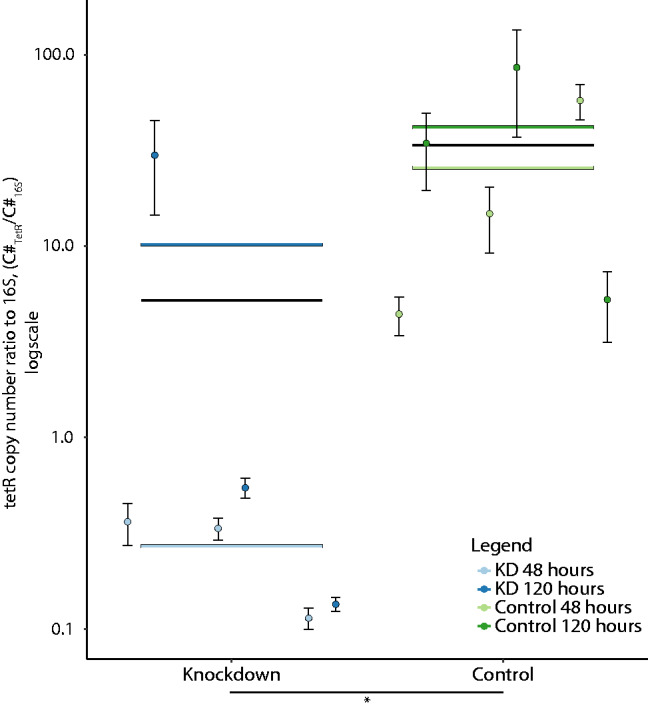
Analysis of TetR (CAETHG_0459) KD effect on expression using RT-qPCR. Copy number (C#) ratio of TetR to 16S from KD (guide-2 (+79), blue) and negative control (CAETHG_0533 guide-4, green). Data represented as points are average of technical replicates, where error bars represent standard deviation. The points are grouped by biological replicate (N = 3) and split into 48 and 120 h sampling points (light color/left and dark color/right, respectively). Bars represent means of data and are associated to their respective points if colored, while black bars are associated to KD and control (i.e. both timepoints). The difference between the means of KD and control samples was shown to be statistically significant using various methods, represented as P < 0.05 here (see Supplementary Text for various methods’ P-values).
