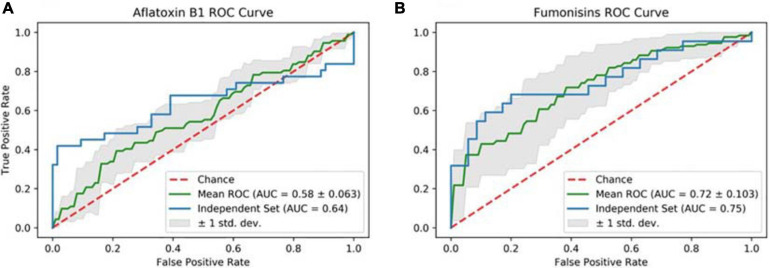
FIGURE 1.
Receiver operating characteristics (ROC) curves for the independent data set for the (A) aflatoxin B1 and (B) FBs models. The solid blue lines represent the ROCs for the two models. The goodness-of-fit of the models is conveyed as the area under the curve (AUC): the higher it is, the better the model performed. The dotted red line represents the random prediction.

