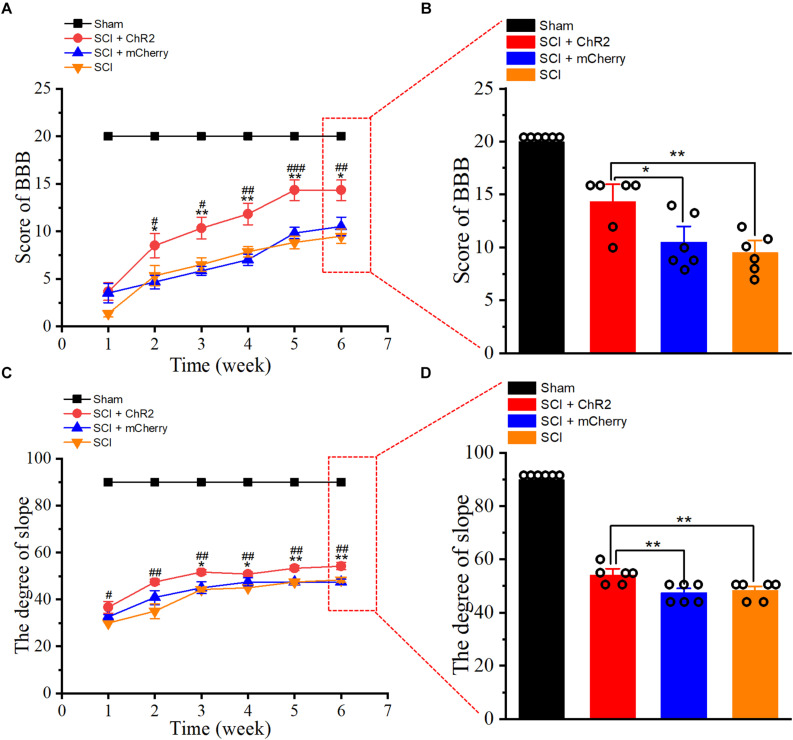
FIGURE 3.
Accurate stimulation of M1 glutamatergic neurons promotes functional recovery after SCI in rats. (A) The line chart of BBB score of rats at 1–6 weeks after SCI. (B) The histogram of BBB score of rats at 6 weeks after SCI. (C) The line diagram of ramp stability angle of rats 1–6 weeks after SCI. (D) The ramp stability angle diagram of rats 6 weeks after SCI. [in chart A, C: * indicates P < 0.05 between SCI + ChR2 group and SCI + mCherry group, **indicates P < 0.01, #indicates P < 0.05 between SCI + ChR2 group and SCI group, ##indicates P < 0.01, ###indicates P < 0.001; in chart B, D histograms: * indicates P < 0.05, **indicates P < 0.01, n = 6 rat/group, using one-way ANOVA. Data are shown as means (bar graphs) and standard error of the mean (error bars), with individual data points indicated as circles].

