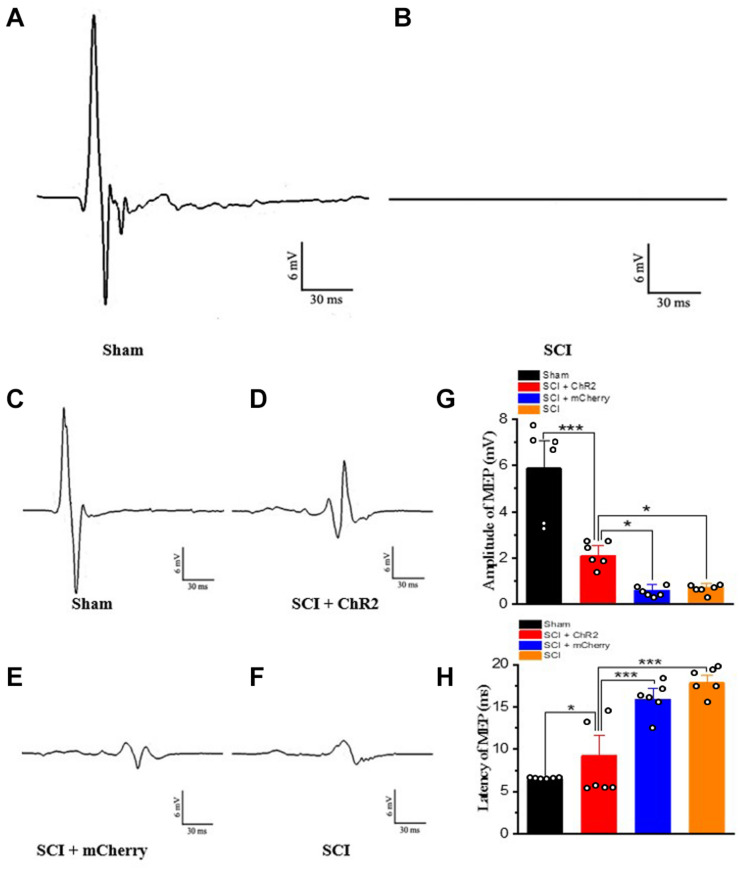
FIGURE 4.
Accurate stimulation of M1 glutamatergic neurons in rats after SCI. (A) The results of motor evoked potentials on the first day after operation in the sham group. (B) The results of motor evoked potentials of SCI rats on the first day after the operation. (C–F) The test results of motor evoked potentials of the corresponding groups at the 6th week, respectively. (G) The histogram display of the amplitude of motor evoked potentials of each group. (H) The histogram display of the incubation period of the motor evoked potentials of each group. [*indicates P < 0.05, *** indicates P < 0.001, n = 6 rat/group, using one-way ANOVA. Data are shown as means (bar graphs) and standard error of the mean (error bars), with individual data points indicated as circles].

