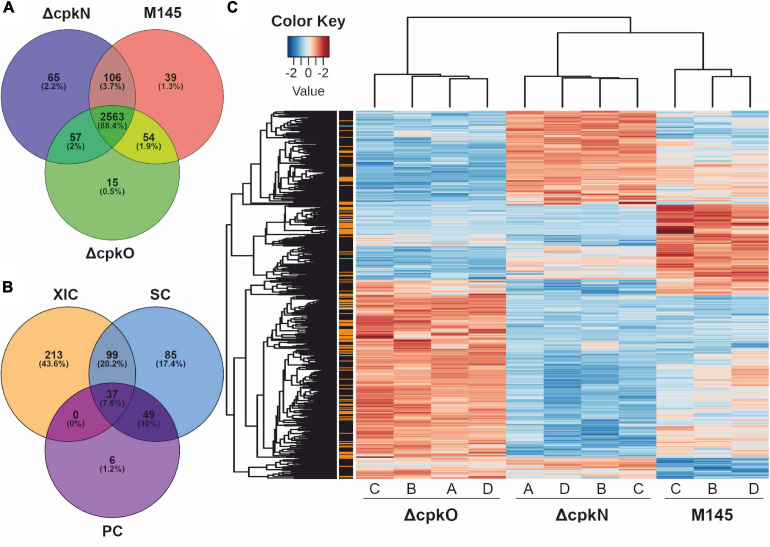
FIGURE 2.
Proteomic analysis of S. coelicolor A3(2) wild-type (M145) and mutant strains. (A) Protein identifications in the analyzed strains. (B) Quantification of 489 proteins showing significant abundance change between the strains (ANOVA test, adjusted p value <0.01); methods: XIC, extracted ion chromatograms; SC, spectral count; PC, peak count. (C) Global heatmap representation of protein abundances with significant abundance change in function of the different strains (ANOVA test, adjusted p value <0.01). The method of quantification of each protein is indicated in colors on the left of the heatmap for extracted ion chromatogram (black), spectral count (orange) or peak count (cyan).

