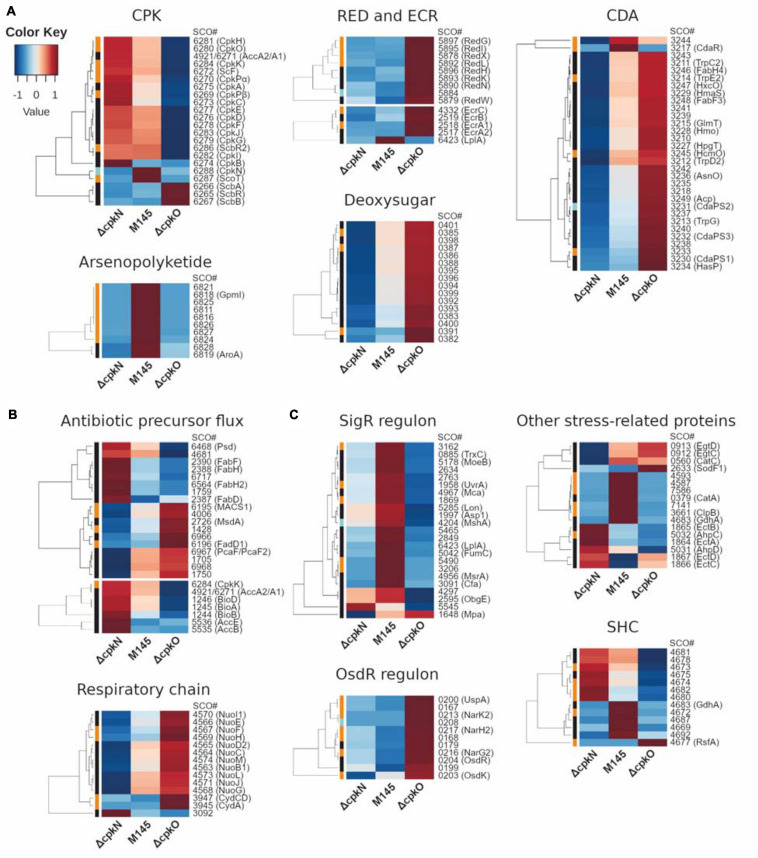
FIGURE 3.
Heatmap representation of mean abundances of proteins in S. coelicolor A3(2) M145, ΔcpkO and ΔcpkN strain. (A) Proteins from specialized metabolite biosynthetic clusters; ECR, expression correlated with RED. (B) Proteins associated with primary metabolism. (C) Proteins related to stress response and others; SHC, supercoiling-hypersensitive cluster. The method of quantification of each protein is indicated in colors on the left of the heatmap for extracted ion chromatogram (black), spectral count (orange) or peak count (cyan).

