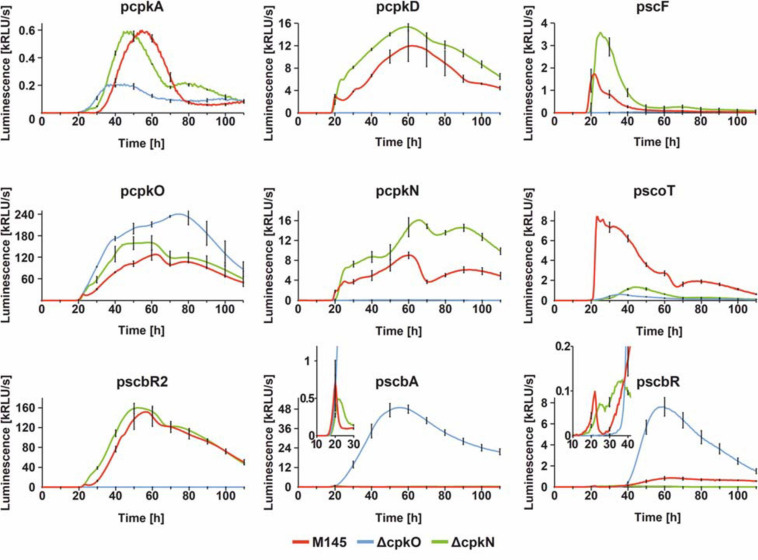
FIGURE 4.
Transcriptional profiles cpk cluster promoters. The charts show luciferase-based reporter system measurements over 110 h of growth with sampling time of 30 min. For clarity, standard deviation was shown for every 10 h time-point. In case of pscbA and pscbR profiles, parts of the graphs were zoomed in to better visualize the differences in earlier time-points.

