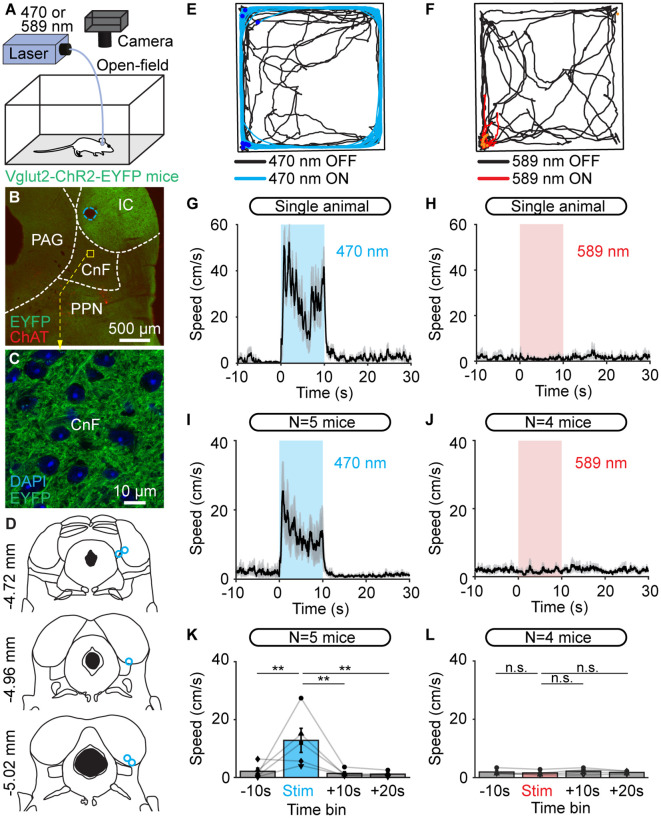
Figure 2.
Optogenetic stimulation of the cuneiform nucleus (CnF) increases locomotor speed in the open-field arena in Vglut2-ChR2-EYFP mice. (A) An optic fiber implanted in the right CnF was connected to a blue laser (470 nm) or red laser (589 nm). Animals were placed in an open-field arena (40 × 40 cm) and their movements were recorded using a camera placed above. (B) Photomicrograph showing the position of the optic fiber (dashed blue line) ~500 μm above the target site. The cholinergic neurons of the pedunculopontine nucleus (PPN; choline acetyltransferase positive, ChAT, red) and the expression of EYFP (green) are visible. (C) Magnification of the slice in (B) at the level of the CnF, showing the expression of ChR2-EYFP. (D) Location of the optic fibers (blue circles) after histological verification as illustrated in (B), with the relative position to the bregma. (E,F) Raw data showing the effects of 10 optogenetic stimulations with a 470 nm laser (E, light blue lines, 10 s train, 20 Hz, 10 ms pulses, 11% of laser power) or a 589 nm laser (F, red lines, 10 s train, 20 Hz, 10 ms pulses, 53% of laser power). A time interval of 80 s was left between two trains of stimulation. Therefore, the time elapsed is different during stimulation (10 s, red or blue traces) and rest (80 s, black traces). The position of the animal’s body center was tracked frame by frame with DeepLabCut (see “Materials and Methods” section). Dark blue dots (E) and orange dots (F) illustrate the onset of each stimulation. (G,H) Locomotor speed (mean ± SEM) as a function of time before, during, and after a 10 s optogenetic stimulation (onset at t = 0 s) with a 470 nm laser (G) or 589 nm laser (H) in a single animal (same animal as in E,F). (I,J) Locomotor speed (mean ± SEM) before during and after optogenetic stimulation with a 470 nm laser in five animals (I, 10 stimulations per animal, 10–24% of laser power) and with the 589 nm laser in four animals (J, 10 stimulations per animal, 40–53% of laser power). (K,L) Locomotor speed (mean ± SEM) before (−10 to 0 s), during (0 to +10 s), and after optogenetic stimulation ( +10 to +20 s and +20 to +30 s) with the 470 nm laser in five animals (K) and with the 589 nm laser in four animals (L; 10 stimulations per animal, **P < 0.01, n.s.: not significant, P > 0.05, Student-Newman-Keuls test after a one way ANOVA for repeated measures, P < 0.01 in K and P > 0.05 in L).

