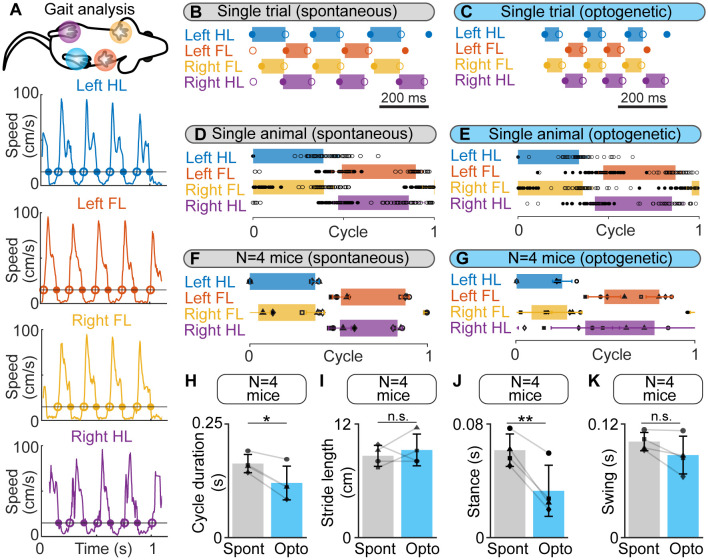
Figure 3.
Gait diagrams during spontaneous locomotion and locomotion evoked by optogenetic stimulation of the cuneiform nucleus (CnF) in Vglut2-ChR2-EYFP mice in a linear corridor. (A) Mouse forelimbs (FL) and hindlimbs (HL) were filmed from below at 300 fps in a transparent linear corridor and the position of each limb was tracked frame by frame with DeepLabCut (see “Materials and Methods” section). The four panels show the movement speed of each paw as a function of time. Cycle duration was defined as the time duration between two touchdowns of the left hindlimb (HL) using a speed threshold of 15 cm/s to define the transitions between swing and stance phases. Full circles are touchdowns; empty circles are lift-offs. (B,C) Gait diagram for each limb obtained during a single spontaneous locomotor bout (B) and a locomotor bout evoked by optogenetic stimulation in the same animal (470 nm laser, 10 s train, 20 Hz, 10 ms pulses, 8% of laser power). Stance phase duration was drawn with a rectangle only when both touchdown and lift-off were present in the recording. (D,E) Gait diagrams during a normalized locomotor cycle, showing the stance phase start (mean ± SD) and end (mean ± SD) during 16 spontaneous locomotor bouts (45 steps) and during 8 locomotor bouts evoked by optogenetic stimulation in the same animal (48 steps, same stimulation parameters as in E). The cycle has been normalized to the left HL’s touchdown. (F,G) Normalized gait diagram showing the touchdown (mean ± SD) and lift-off (mean ± SD) pooled from four mice during a total of 55 spontaneous locomotor bouts (8–16 trials per animal, 13–45 steps per animal) and from four mice during a total of 30 locomotor bouts (6–8 bouts per animal, 8–48 steps per animal) evoked by CnF optogenetic stimulation (470 nm laser, 10 s train, 20 Hz, 10 ms pulses, 8–15% of laser power). The data from each animal are illustrated with a different symbol. (H–K) Comparison of cycle duration (H) stride length (I) stance duration (J) and swing duration (K) in four animals during spontaneous optogenetic-evoked locomotion (same animals as in F,G). *P < 0.05, **P < 0.01, n.s., not significant, P > 0.05, paired t-tests.

