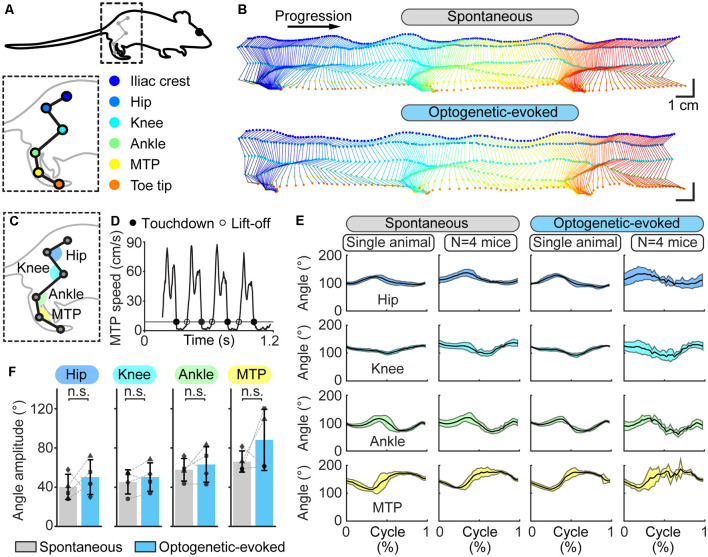
Figure 4.
Hindlimb kinematics during spontaneous locomotion and locomotion evoked by optogenetic stimulation of the cuneiform nucleus (CnF) in Vglut2-ChR2-EYFP mice in a linear corridor. (A) Six hindlimb joints were labeled with a white paint marker and were filmed from the side at 300 fps in a transparent linear corridor and the trajectory of each joint was extracted with DeepLabCut and plotted in a different color (see “Materials and Methods” section). (B) Side view of the hindlimb joints during spontaneous locomotion (top) and optogenetic-evoked locomotion (470 nm laser, 10 s train, 20 Hz, 10 ms pulses, 8% of laser power) (bottom). Total time elapsed from first to last frames is 700 ms (top) and 500 ms (bottom). (C) Joint angles at the hip, knee, ankle, and metatarsophalangeal joint (MTP) levels were calculated frame by frame using the position of the joint of interest and those of two proximal joints. (D) Cycle duration was defined as the time duration between two consecutive touchdowns of the MTP using a speed threshold of 9 cm/s to define the transitions between swing and stance phases. Full circles are touchdowns; empty circles are lift-offs. (E) Joint angles (mean ± SD) at the hip, knee, ankle and MTP levels plotted for a normalized locomotor cycle during spontaneous locomotion (29 steps) and locomotion evoked by optogenetic stimulation (31 steps; 470 nm laser, 10 s train, 20 Hz, 10 ms pulses, 8% of laser power). For the pooled data, joint angles (mean ± SD) of four animals plotted for a normalized locomotor cycle during spontaneous locomotion (8–29 steps per animal) and locomotion evoked by optogenetic stimulation are shown (2–31 steps per animal; 470 nm laser, 10 s train, 20 Hz, 10 ms pulses, 8–15% of laser power). (F) Amplitude of the hip, knee, ankle, and MTP angles measured in four animals during spontaneous and optogenetic evoked locomotion (same data as in E). n.s., not significant, P > 0.05, paired t-tests.

