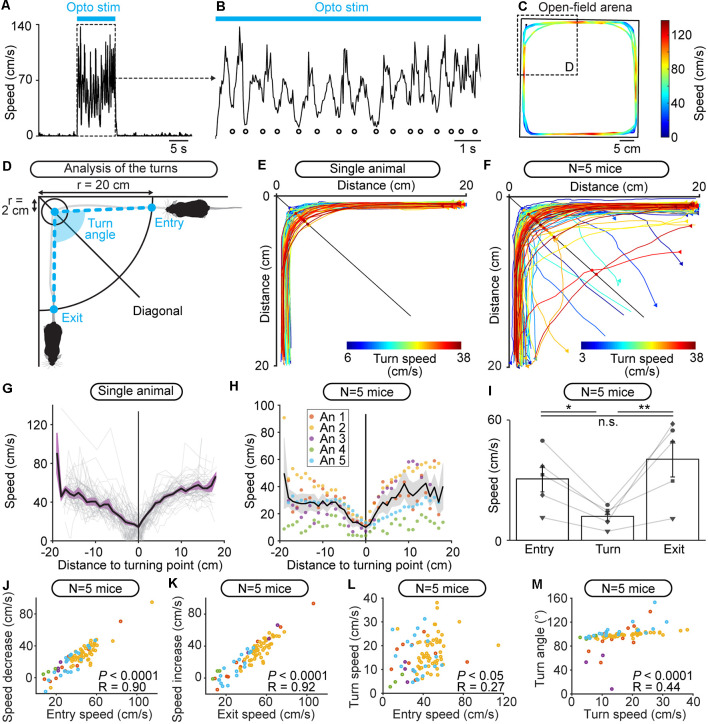
Figure 5.
Freely behaving mice brake and turn during locomotion evoked by optogenetic stimulation of the cuneiform nucleus (CnF) in Vglut2-ChR2-EYFP mice in the open-field arena. (A) Raw data showing that locomotor speed is modulated during optogenetic stimulation of the CnF (470 nm laser, 10 s train, 20 Hz, 10 ms pulses, 11% of laser power). (B) Magnification of (A) showing rhythmic speed decrease (white circles) during CnF stimulation (blue solid line). (C) Color plot illustrating the locations of the speed decreases during CnF stimulation in the open-field arena (same data as in A,B). Colder colors (blue) illustrate slower speeds. (D) Animal’s speed was measured when moving in 20 cm circles centered on each corner of the arena. The speed at the entry of the corner, during the turn (in a 2 cm circle centered on the location where the animal crossed the corner’s diagonal), and at the exit of the corner was calculated (see “Materials and Methods” section). The turn angle was measured between the positions of the animal: (i) at the entry of the corner; (ii) during the turn; and (iii) when exiting the corner (see “Materials and Methods” section). (E,F) Raw data showing the extracted locomotor trajectories in the corners of the arena during optogenetic-evoked locomotion in a single animal (E, 470 nm laser, 10 s train, 20 Hz, 10 ms pulses, 11% of laser power) and in five animals (F, 470 nm laser, 10 s train, 20 Hz, 10 ms pulses, 10–24% of laser power). Warmer colors (red) illustrate trajectories with higher speeds during the turn. Triangles illustrate movement onsets. Dots illustrate diagonal crossings. (G) Locomotor speed as a function of the distance to the corner’s diagonal during each turn (gray) shown in (E) for a single animal. In black, the averaged speed (± sem in purple) is shown. (H) Locomotor speed as a function of the distance to the diagonal during the turns of the five animals (An) illustrated in (F). In black, the mean speed (± sem in gray) is shown. (I) Entry speed, turn speed and exit speed for five animals (10 stimulations per animal, *P < 0.05, **P < 0.01, n.s., not significant, P > 0.05, Student-Newman-Keuls test after a one way ANOVA for repeated measures, P < 0.01). (J) Relationship between the speed at corner entry, and the difference between entry speed and turn speed in five mice (linear fit, P < 0.0001, R = 0.90, n = 87 turns pooled from 50 stimulations, 10 stimulations per animal). (K) Relationship between the speed at corner exit, and the difference between exit speed and turn speed (linear fit, P < 0.0001, R = 0.92). (L) Relationship between the speed at corner entry and the turn speed (linear fit, P < 0.05, R = 0.27). (M) Relationship between the turn speed and the turn angle (linear fit, P < 0.0001, R = 0.44).

