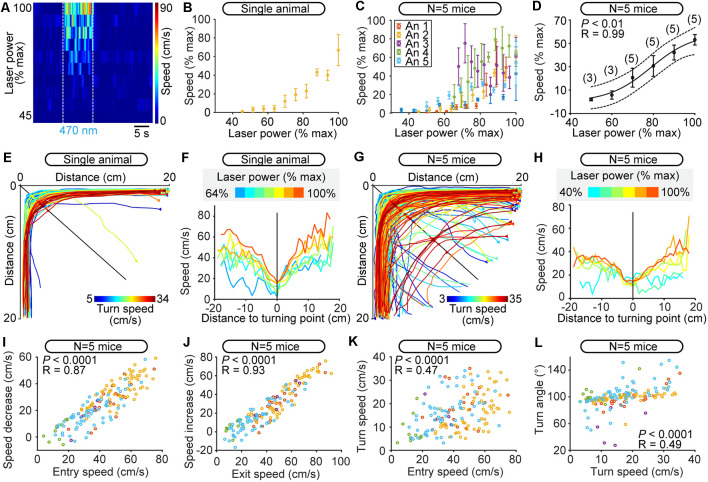
Figure 6.
Robustness of scaled control of speed during turning at different speeds controlled by the level of optogenetic stimulation of the cuneiform nucleus (CnF) in Vglut2-ChR2-EYFP mice in the open-field arena. (A) Color plot illustrating the increase in overall locomotor speed in the open-field arena (cm/s) evoked by increases in laser power (6–13% of laser power) in a single animal (470 nm laser, 10 s train, 20 Hz, 10 ms pulses). Speed was calculated during the 10 s stimulation period, during which multiple turns could occur. Plotted laser powers were normalized as a percentage of their maximal value used per animal (% max). Each line illustrates the speed as a function of time for a given laser power expressed as a percentage of maximal laser power used for this animal. White dotted lines indicate the onset and offset of optogenetic stimulation. Warmer colors (red) indicate higher speeds. (B) Locomotor speed (1–42 cm/s) as a function of laser power (6–13% of laser power) in one animal. Each dot represents the speed (mean ± SEM) over three stimulations. Speed and laser power were normalized as a function of their maximal values (% max). (C) Relationship between locomotor speed (0.2–42.0 cm/s) and increasing laser power (6–27% of laser power) for all animals. Data from each mouse are illustrated with a different color. Each dot represents the speed (mean ± SEM) over three stimulations. Speed and laser power were normalized as a percentage of their maximal values per animal (% max). (D) Relationship between locomotor speed (mean ± SEM) and laser power in the same animals as in C, this time with data binned as a function of maximal laser power used per animal (% max) with a bin size of 10%. Speed and laser power were normalized as a percentage of their maximal values per animal (% max). The data followed a sigmoidal function (solid black line, P < 0.01, R = 0.99). The dotted lines illustrate the 95% prediction intervals. (E–G) Raw data showing the extracted locomotor trajectories in the corners of the arena during optogenetic-evoked locomotion in a single animal (E) and in five animals (G) Triangles illustrate movement onsets. Dots illustrate diagonal crossings. Warmer colors (red) illustrate higher turn speeds. (F–H) Locomotor speed as a function of the distance to the diagonal during the turns for increasing power of optogenetic stimulation of the CnF in a single animal (F, 470 nm laser, 10 s train, 20 Hz, 10 ms pulses, 6–13% of laser power) and in five animals (H, 470 nm laser, 10 s train, 20 Hz, 10 ms pulses, 6–27% of laser power). Warmer colors (red) indicate stronger optogenetic stimulation of the CnF. Laser powers were normalized as a percentage of their maximal value used per animal (% max) and were binned in H (bin width: 10%). In (F), each curve was obtained from 1 to 14 turns in a single animal. In (H), each curve was obtained from 2 to 73 turns pooled from five animals. (I) Relationship between the speed at corner entry, and the difference between entry speed and turn speed (linear fit, P < 0.0001, R = 0.87, N = 157 turns pooled from 150 stimulations, 30 stimulations per animal). (J) Relationship between the speed at corner exit, and the difference between exit speed and turn speed (linear fit, P < 0.0001, R = 0.93). (K) Relationship between the speed at corner entry and the turn speed (linear fit, P < 0.0001, R = 0.47). (L) Relationship between the turn speed and the turn angle (linear fit, P < 0.0001, R = 0.49).

