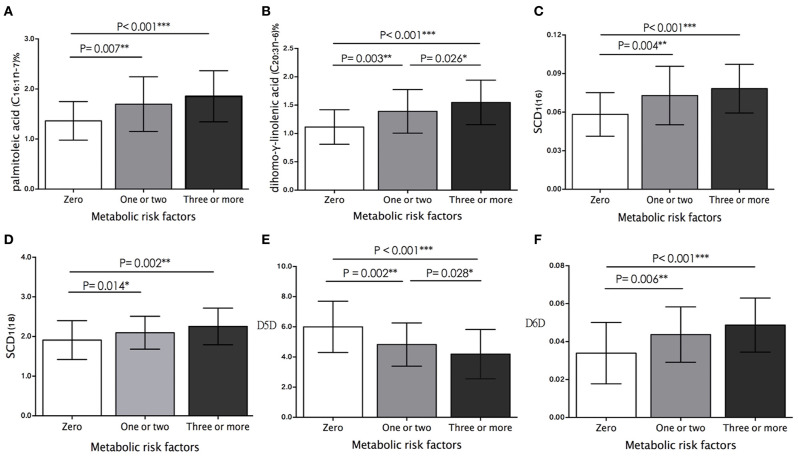
Figure 1.
Comparison of plasma (A) palmitoleic acid proportion, (B) dihomo-γ-linolenic acid proportion (DGLA), and estimated activity of (C) SCD1(16), (D) SCD1(18), (E) D5D, and (F) D6D between study participants who had zero, one or two, and more than three metabolic risk factors. Histograms were prepared using mean values and SD. The differences between study groups are based on ANOVA test with multiple comparison analysis. Significance levels: *P < 0.05, **P < 0.01, ***P < 0.001.

