Fig. 2.
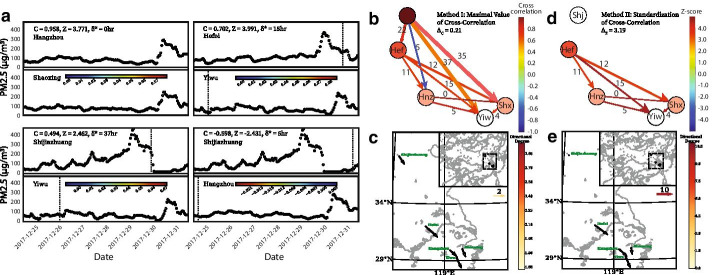
Illustration of network definition methods during haze event in eastern China during December of 2017. a Time series of PM2.5 concentrations colored by contribution to the generated correlation among pairs of cities. We showcase the highest positive correlation (Hangzhou–Shaoxing) and Z-score (Hefei–Yiwu) pairs and two pairs, one positive (Shijiazhuang–Yiwu) and one negative (Shijiazhuang–Hangzhou), that generated links only under Method I. b, d Network visualizations under Methods I and II respectively with nodes colored by out degree, links by weights and width representing the time lag. Method II returns less densely connected networks. In Shijiazhuang, PM accumulates gradually and is more auto-correlated. The generated correlations by Method I are not considered significant in Method II returning Z-scores lower than the critical threshold. c, e Distribution of directional degrees in the positive correlations networks under Methods I and II respectively illustrating the PM transport spreading southeast

