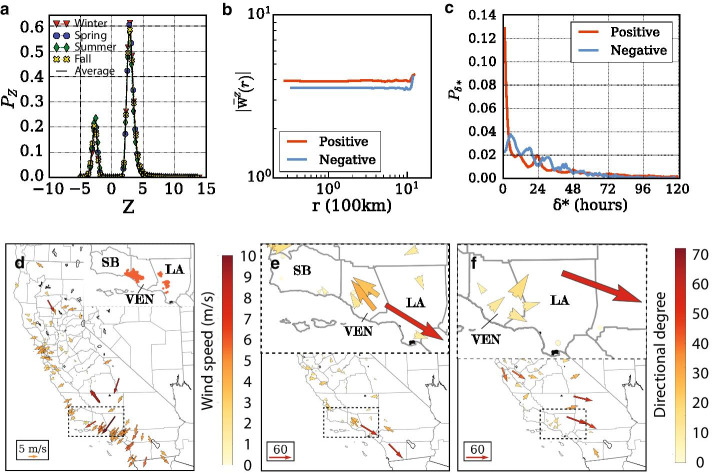
Fig. 4.
Framework implementation in California, suggesting universality of PM transport patterns. a Bi-modal distribution of Z-scores, b distance independent Z-scores, c 12 h periodicity of time-lags. Wind and diffusion during wildfire event. d Average daily wind flows on December 7th indicative of the easterly circulation during Santa Ana phase e, f Spatial distribution of positive directional weighted degrees in the Z networks during (Dec. 4th–Dec. 10th) and after (Dec. 11th–Dec. 17th) the Santa Ana wind stage

