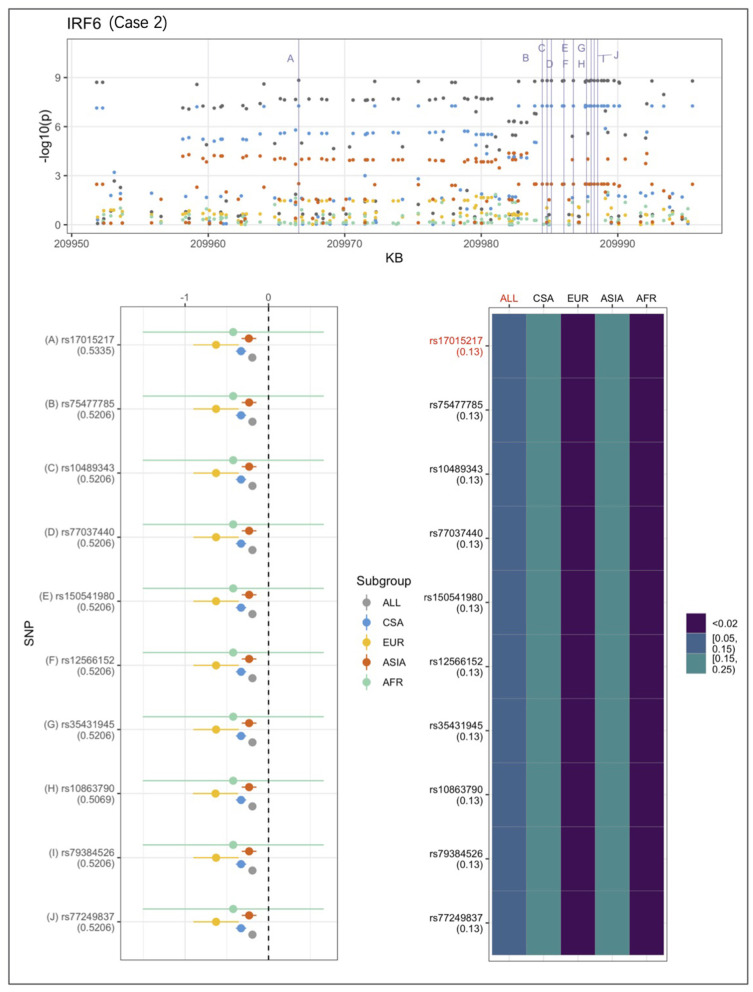
Figure 3.
Association peak in 1q32.2 (IRF6) consistent with category 2. SNPs are ordered by base-pair position; Q-statistic p-value noted under each SNP in forest plot; lead variant and sample with highest p-value shown in red in heatmap and FST values noted under each SNP. The top 10 associated variants fall below our MAF filter in the EUR and ASIA groups.

