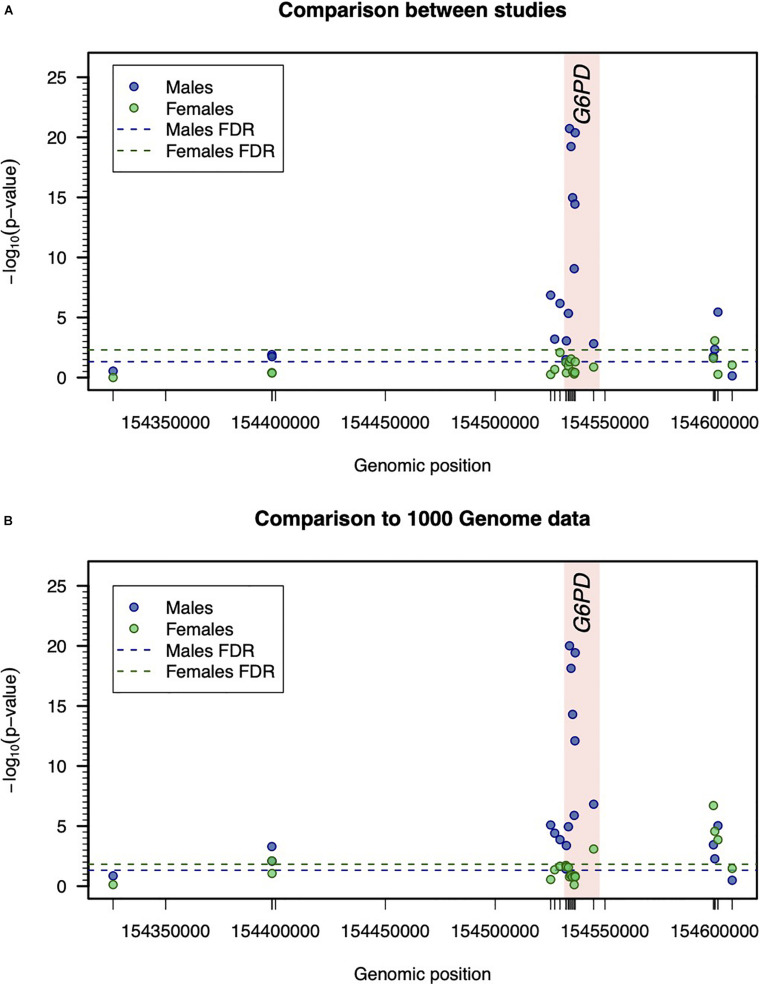
FIGURE 2.
Inter-study variation with respect to the genetic data. (A) Comparison of genotype frequencies between studies. Statistical significance was determined by –log10 (p-value) associated with the Pearson’s test for independence in two-way frequency tables. For males and females, the thresholds for statistical significance were calculated separately and were determined to ensure a false discovery rate (FDR) of 5%. (B) Comparison between allelic frequencies between studies and 1000 Genome Project data. The reported –log10 (p-value) refers to the minimum p-value of Binomial test for comparing the allelic frequency of a given SNP in each study assuming the respective allelic frequency of 1000G project data as the one under the null hypothesis (see Table 2).

