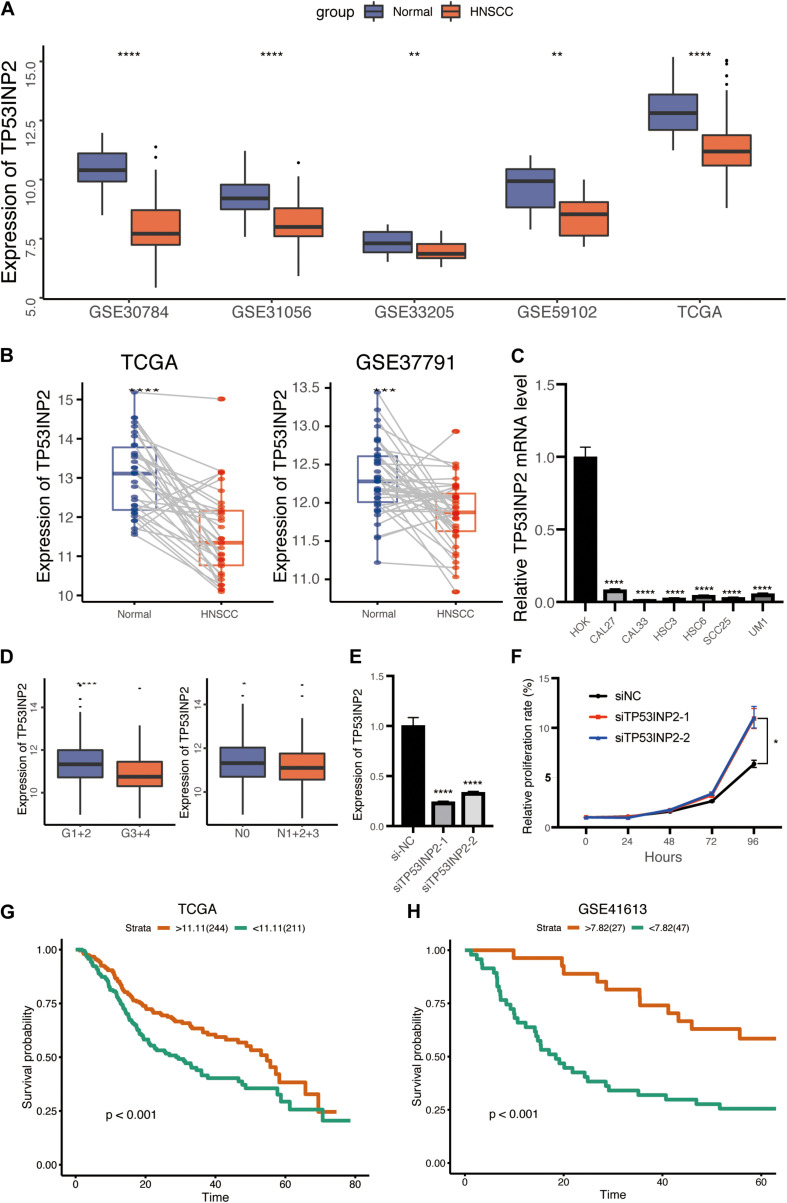
FIGURE 1.
Low expression of TP53INP2 predicts prognosis in HNSCC. (A) Box plot of TP53INP2 expression between HNSCC and normal controls in multiple datasets. (B) Box plot of TP53INP2 expression between HNSCC and paired normal controls. (C) The relative expression of TP53INP2 expression between HNSCC cell lines and normal controls. (D) Box plot of TP53INP2 in grade and lymphatic metastasis subgroup. (E) TP53INP2 mRNA levels in CAL27 cell transfected with TP53INP2 siRNA. (F) Relative cell viability of CAL27 cell was measured by the CCK-8 at indicated time points. (G,H) Survival analysis of TP53INP2 in TCGA and GSE41613.

