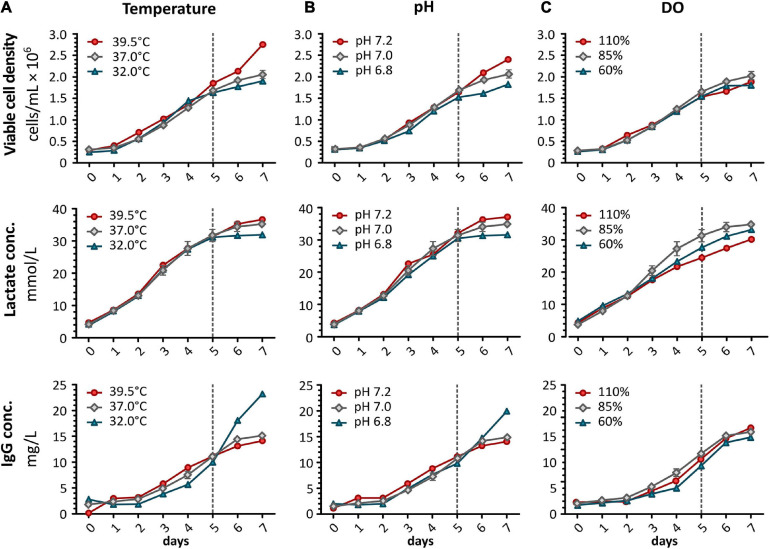
FIGURE 2.
For bioprocess monitoring of CHO DP-12 batch cultures, viable cell density was determined daily using the trypan blue exclusion method. Additionally, lactate concentration and IgG production were analyzed using a Cedex Bio Analyzer (Roche). Shown are results after shifting (A) temperature, (B) pH, or (C) DO concentration. Red shows an increase whereas blue indicates a reduction of the correlating parameter. Results obtained from standard conditions are shown in gray (mean ± standard deviation, n = 3). Dashed line indicates time point (day 5) for alterations of process parameters.

