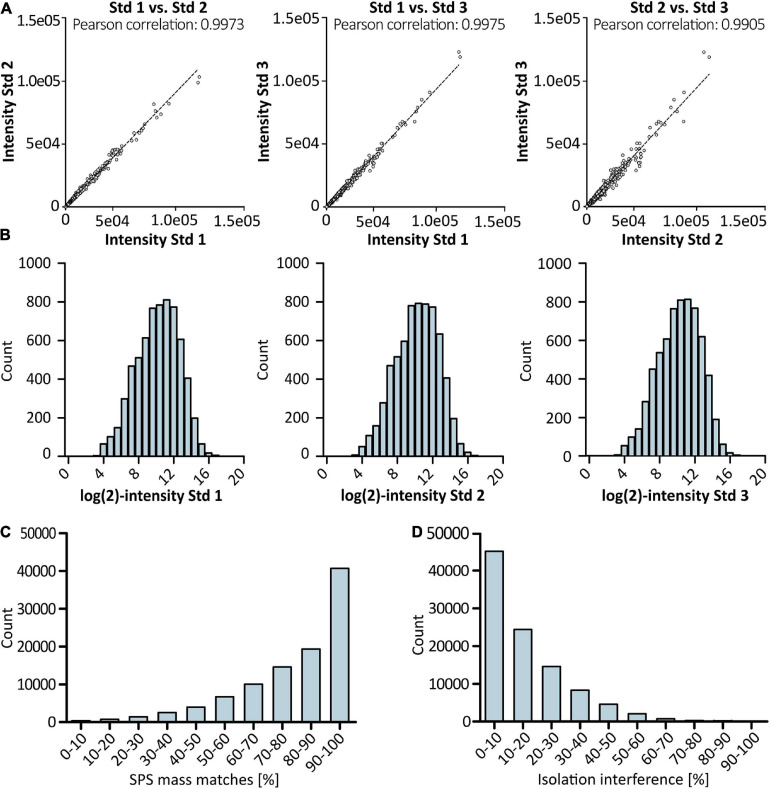
FIGURE 3.
Results of proteomic profiling using LC/LC-SPS-MS3. Scatter plots in (A) show Pearson correlation between biological replicates derived from cells grown under standard conditions (n = 3). TMT reporter intensity values were log-transformed and plotted in a histogram (B) to show distribution of quantification values for control samples. Accuracy of quantification was evaluated by checking SPS match accuracy (C) and precursor ion co-isolation (D) in% of PSMs using Thermo Scientific’s Proteome Discoverer software. For each sample, two technical replicates were analyzed.

