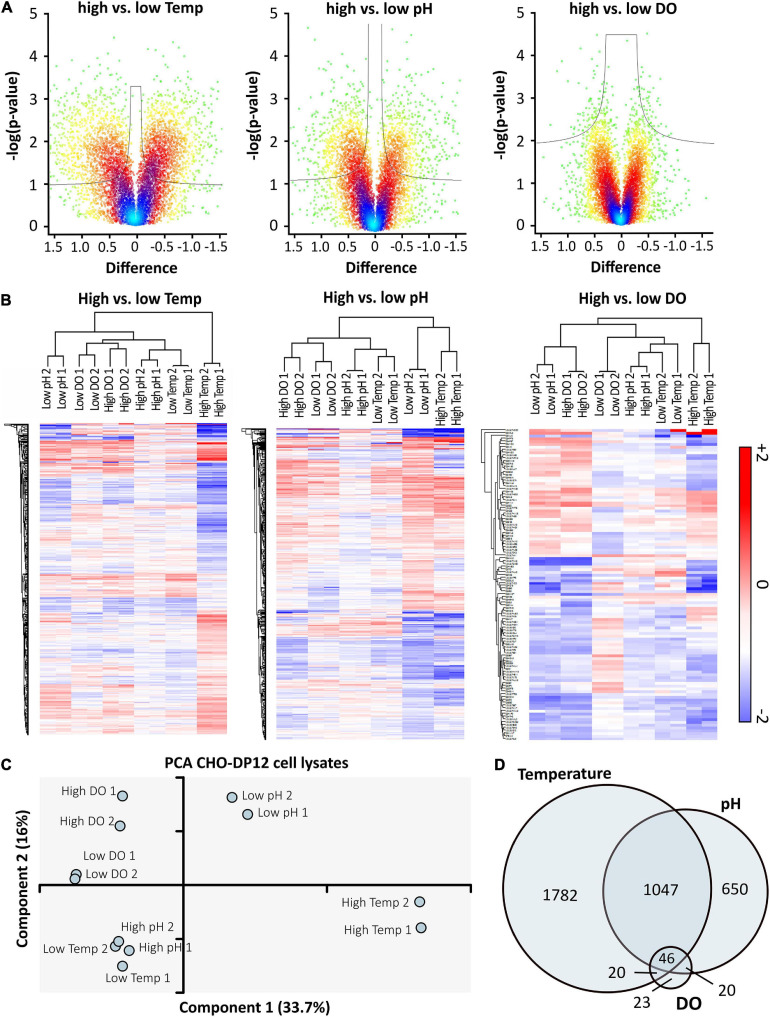
FIGURE 4.
High vs. low cell culture conditions were compared using volcano plots (A) with cut-off curves indicating significance determined by a two-sided t-test with a permutation-based FDR of 0.05 and S0 of 0.03 (n = 2). Color of the plot indicates spatial density. Significantly regulated proteins were used for hierarchical clustering (B) based on Euclidian distance. Red indicates upregulation, blue shows downregulation of proteins compared to standard conditions. The PCA (C) indicates relationships between prepared technical replicates (n = 2) and applied processing conditions. The Venn-diagram (D) shows the overlap of significantly regulated proteins after shifting temperature, pH, or DO concentration. Data was analyzed using Perseus software (version 1.6.6).

