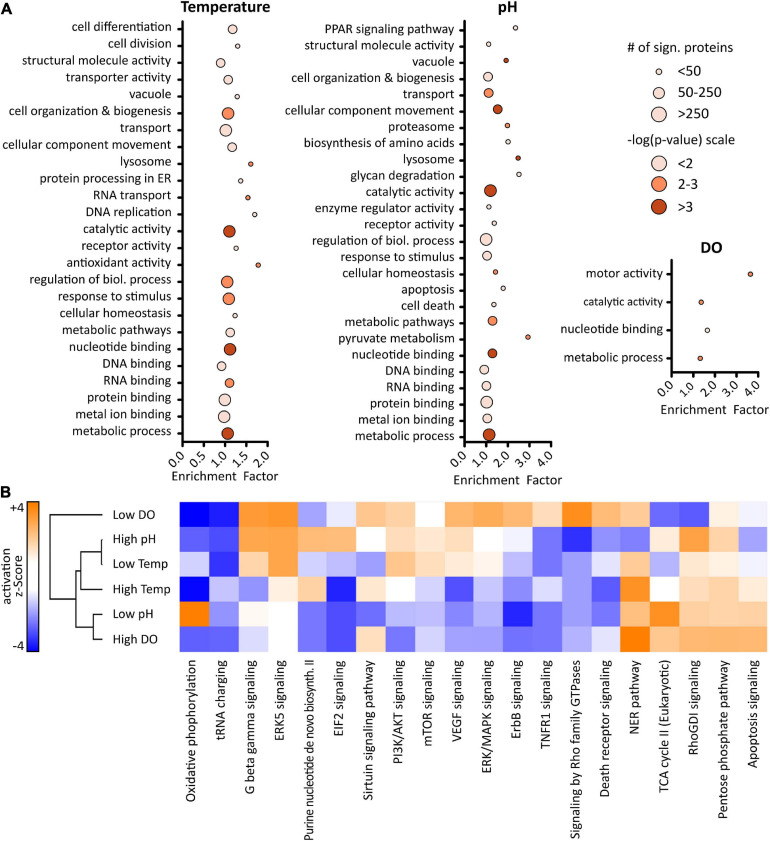
FIGURE 5.
Results of gene ontology (GO) enrichment analysis (A) using a Fisher’s exact test with a p-value ≥ 0.05 performed in Perseus (version 1.6.6). Size of the dots represents number of proteins related to corresponding GO term, color indicates level of significance based on p-value. Ingenuity pathway analysis (B) revealed predicted pathway activation (orange) or inhibition (blue). Activation z-scores greater ± 2 are significant.

