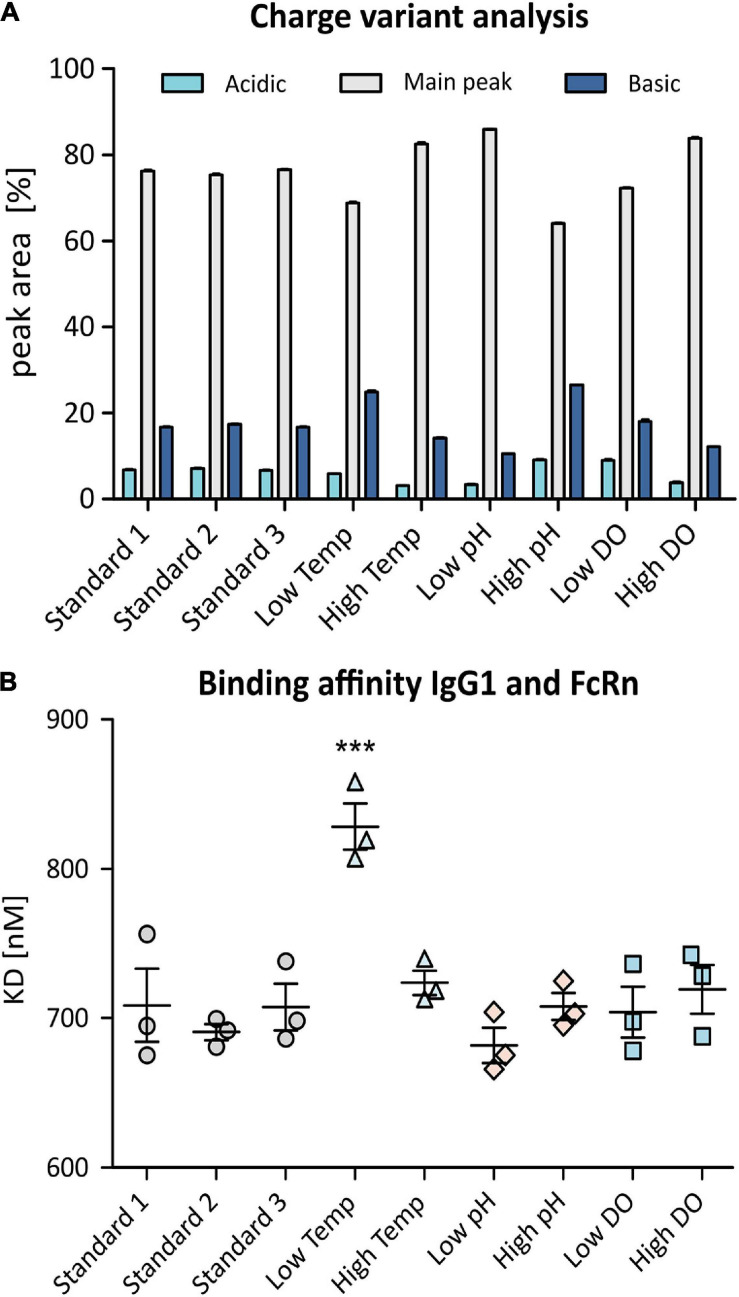
FIGURE 6.
Charge variant analysis (CVA) of produced anti-IL8 IgG1 using SCX-UV (A). Shown are relative peak areas [%] of the main peak (gray) as well as acidic variants (light blue) and basic variants (dark blue). SPR analysis was used to determine binding affinity of the mAb to recombinant human FcRn (B). Samples were analyzed in triplicates. Shown are measured dissociation constants (KD). Significance was determined using an ANOVA with a Tukey’s post-test (***p ≤ 0.001).

