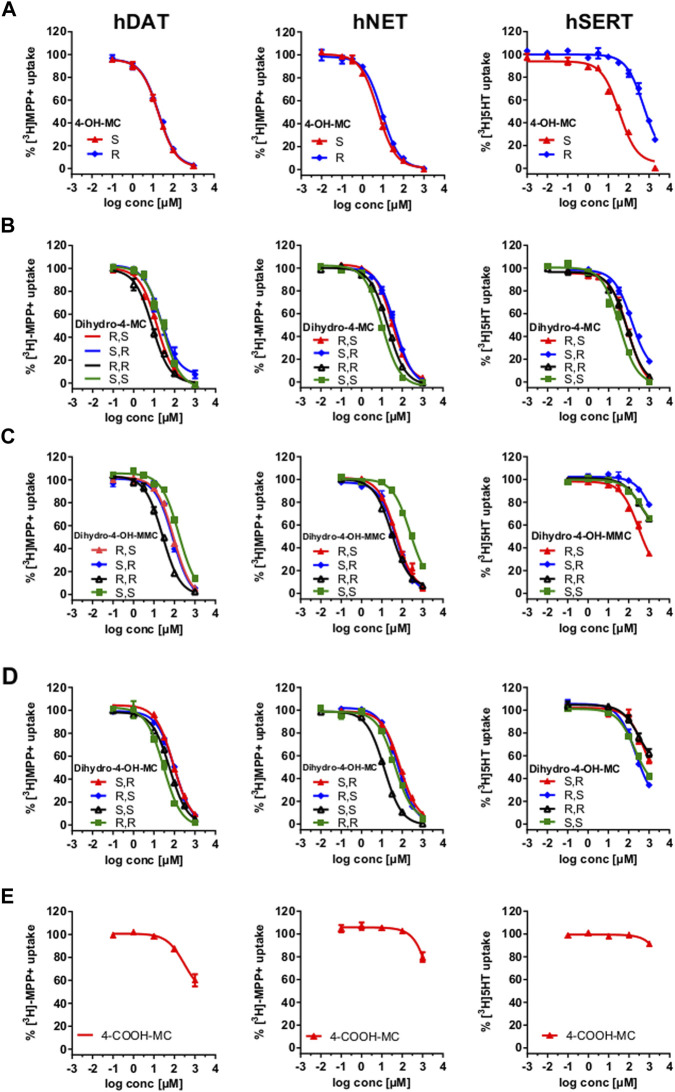
FIGURE 2.
Uptake-Inhibition of the synthesized enantiomers at hDAT (left), hNET (middle) and hSERT (right). Uptake of [3H]MPP+ (DAT and NET expressing cells) and [3H]5-HT (SERT expressing cells) was inhibited with increasing concentrations of the indicated test drugs. Data are shown as the mean ± SEM obtained from 3-5 individual experiments, performed in triplicate. (A) uptake-inhibition of 4-OH-MC enantiomers; (B) uptake-inhibition of dihydro-4 -MC enantiomers; (C) uptake-inhibition of Dihydro-4-OH-MMC enantiomers; (D) uptake-inhibition of Dihydro-4-OH-MC enantiomers; uptake-inhibition of the racemic 4-COOH-MC.

