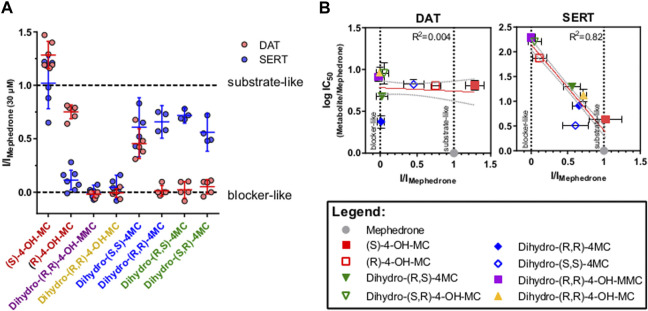
FIGURE 4.
DAT- and SERT-mediated currents of selected metabolites. (A) normalized steady-state current amplitude as (Imetabolite 30µM/IMephedrone 30µM). Data are represented as mean and 95% confidence interval, with dots representing individual cells (red = DAT and blue = SERT). On the x axis, the two enantiomers of the same metabolite are depicted with the same color. (B) correlation analysis for changes in current profile and in IC50s. IC50 values of the different metabolites, obtained in the uptake-inhibition experiments, are normalized to the IC50 of mephedrone. The Log10 of this ratio is plotted against the current ratio and subjected to linear regression. The linear fit of the data is represented by the orange line with the grey dashed lines depicting the 95% confidence interval. For DAT (middle) there is no linear correlation (R 2 = 0.004, F = 0.299, p < 0.586). For SERT (right) the two measures are linearly correlating (R 2 = 0.82, F = 397.8, p < 0.0001).

