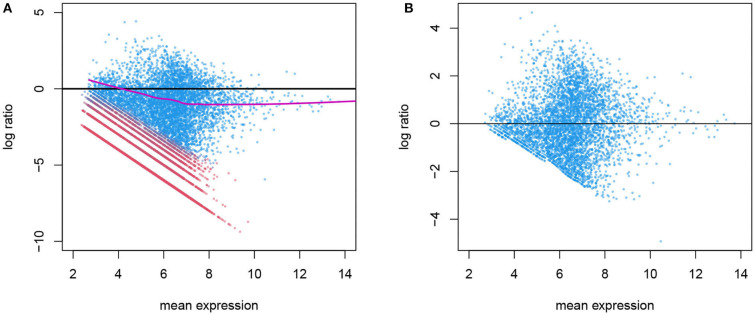
Figure 3.
(A) Before normalization MA plot for gene counts before normalization. The log ratio of a gene's count in one cell over its mean expression level is plotted against the log mean expression (the alpha cells in the T2D data are used here). Genes in active expression phase are shown in blue and genes in background phase shown in red. Only the blue genes are used in estimating the systematic bias, shown in purple. (B) After normalization: the log ratio from normalized genes in the active phase shows no systematic bias.

