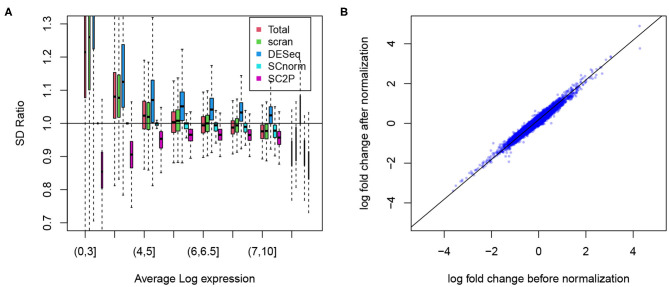
Figure 5.
(A) Reduction of the technical variability among replicate cells. The ratio of gene specific standard deviation in normalized log counts over that in the raw log counts plotted. Genes are displayed in different groups based on their average expression when they are expressed. (B) The log fold change between Alpha and Beta cell populations before and after normalization remains at similar levels.

