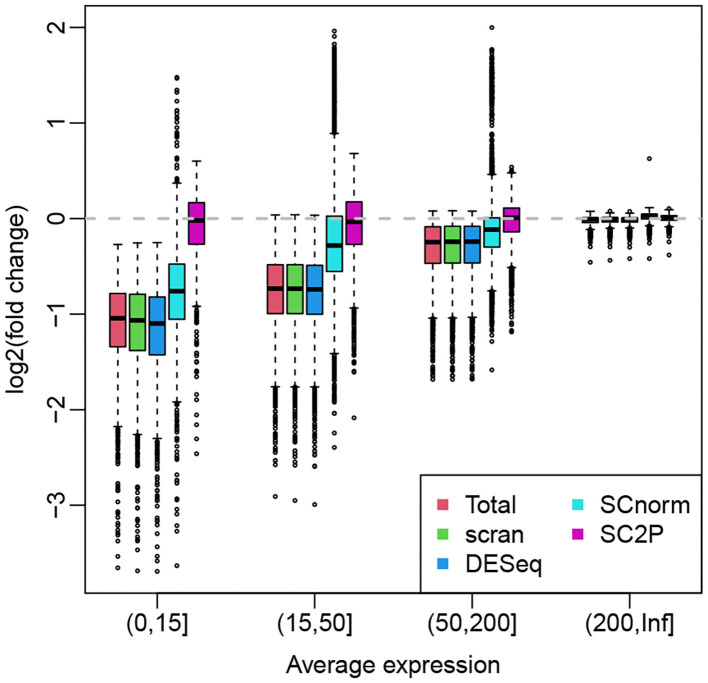
Figure 6.
Box plots of log fold changes of normalized gene expression from different methods. The genes are stratified by average expressions. The log fold changes are computed based a two-group comparison, where the two groups contains cells with high and low sequencing depths. All cells are H1 hES cells.

