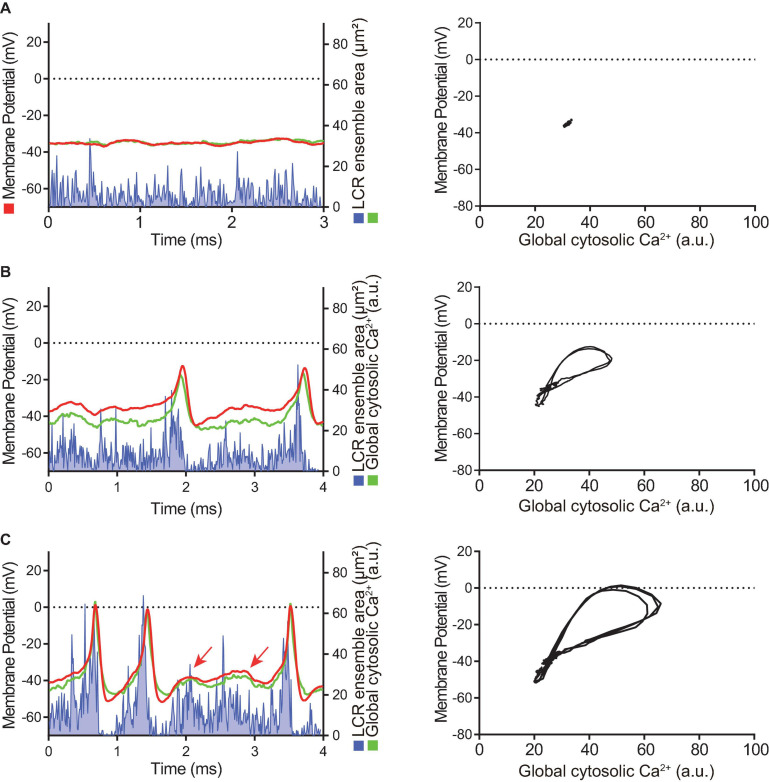
FIGURE 4.
Time domain (left column) and the Ca2+-voltage phase-plot loops (right column) of simultaneous membrane potential (red), whole-cell Ca2+ transient (green) and LCR ensemble area (blue) measurement at the early stage of AP induction in response to β-AR stimulation in a SANC that was electrically dormant at baseline. Note that, to minimize both phototoxicity and bleaching of the Ca2+ indicator, Ca2+ signals could be recorded only for short time window, although membrane potential could be recorded for prolonged periods: (A) Baseline, (B) The first AP, and (C) Following early phase that is characterized by APs with a small amplitude and failed ignition (arrows). Blue line shows the integrated area of detected individual LCRs by our image analysis program (Maltsev et al., 2017).

