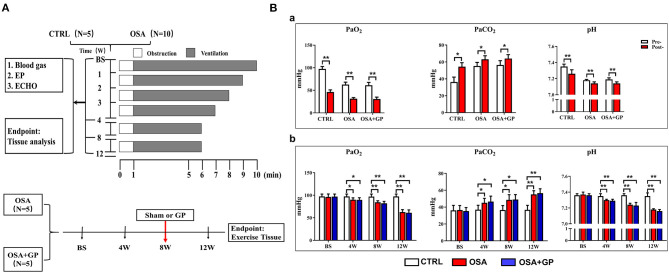
Figure 1.
(A) Study protocol performed on the dogs. (B) Changes in blood gas among the three groups. (a) After 1 min of apnea in the 12th week of simulating OSA; (b) During the 12-week period of OSA simulation before apnea. *P < 0.05, **P < 0.01, n = 5. OSA, obstructive sleep apnea; GP, ganglionated plexus; CTRL, control; BS, baseline; EP, electrophysiology; ECHO, echocardiography; Pre-, pre-apnea; Post-, post-apnea; W, week.

