Figure 3.
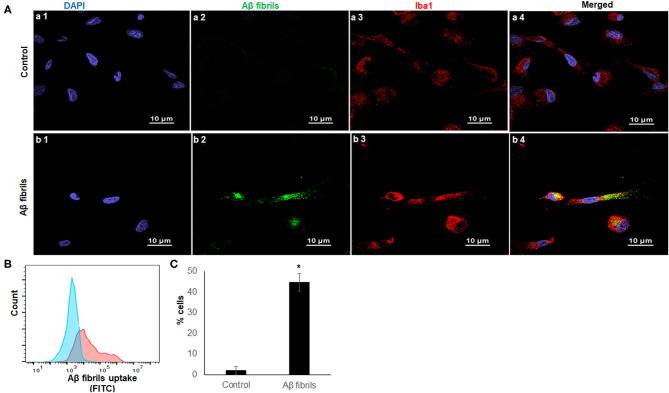
iMG cells phagocytosed fibrillary Aβ42. Confocal imaging and flow cytometry analysis of iMG cells were incubated with human HiLyte™ Fluor 488-labeled Aβ42 proteins. Phagocytosis activity was measured after 4 h incubation. (A) Representative confocal images were shown where controls cells were panel a (a1–a4) and iMG cells with phagocytosed fAβ42 were panel b (b1–b4). Images were captured at 100× with a scale representing 10 μm. fAβ42 and Iba1were stained green and red, respectively. Nuclei were stained blue with DAPI. Merged images of all three channels were shown in a4 and b4. Merged image (b4) indicated Aβ42 proteins were present within the cytoplasm of iMG cells. (B) The Aβ42 protein uptake was quantified by flow cytometry. Representative image of three experiments were shown, where the blue graph was for control and red for iMG cells with engulfed fAβ42. (C) Percentage of cells with engulfed fAβ42 as measured by flow cytometry. The result was from three independent experiments, and the error bars represented ± SD. *p ≤ 0.05 was considered as significant.

