Figure 4.
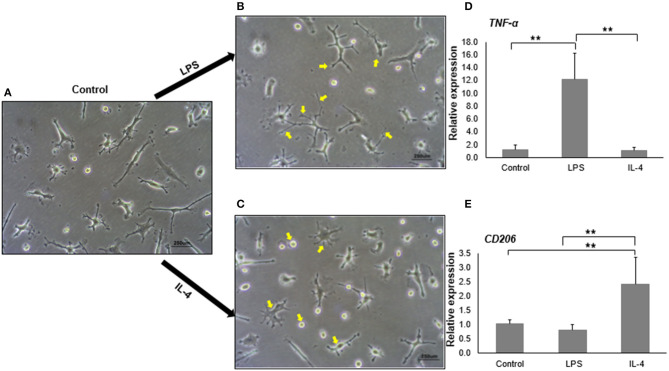
In vitro activation and polarization of iMG cells. The morphology of iMG cells was captured after stimulation with LPS or IL-4 for 24 h. (A) Control iMG cells without any treatment, (B) iMG cells stimulated with 10 μg/ml LPS showing hyper-ramification as indicated with arrows, (C) iMG cells stimulated with 20 ng/ml IL-4 showing ameboid structure as indicated with arrows. Changes in gene expression were analyzed by qRT-PCR showed (D) increased TNF-α levels in LPS-stimulated iMG cells and (E) increased CD206 levels in IL-4-stimulated iMG cells. The experiments were all repeated at least three times. Data were represented as a mean ± SD. Significance between groups were determined by ANOVA test, where ** denoted p < 0.005.

