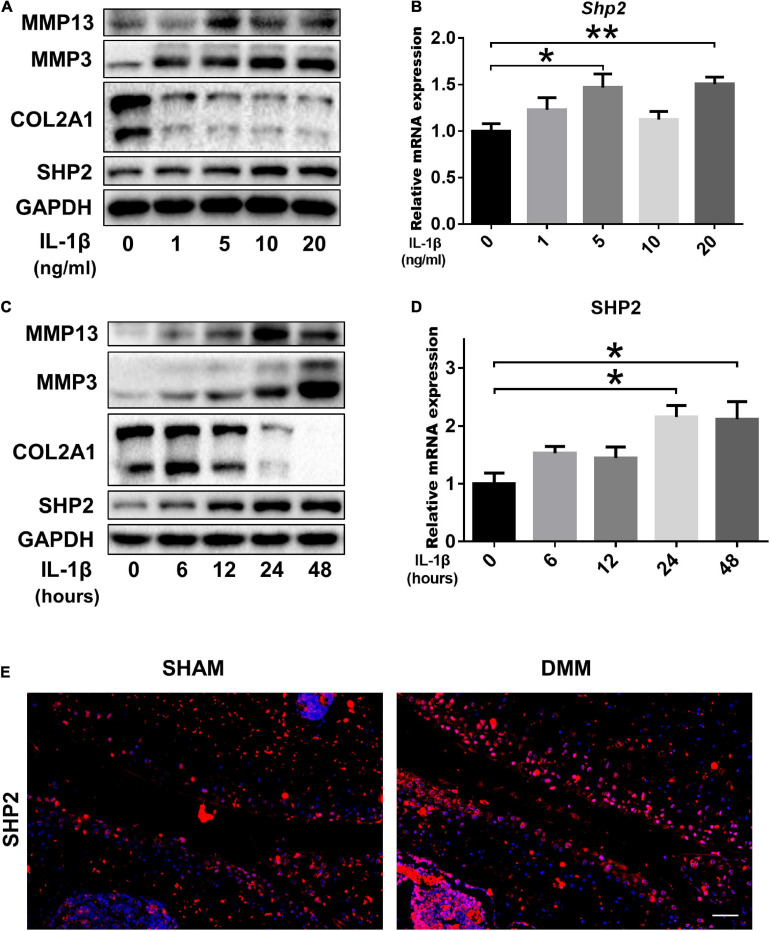
FIGURE 1.
SHP2 expression is increased in primary chondrocytes after IL-1β treatment and in mouse OA cartilage. (A) Representative western blot of MMP3, MMP13, COL2A1, SHP2, and (B) mRNA level of Shp2 determined by qRT-PCR in chondrocytes after stimulation with various doses of IL-1β for 24 h. (C) Representative western blot of MMP3, MMP13, COL2A1, SHP2, and (D) mRNA level of Shp2 determined by qRT-PCR in chondrocytes after stimulation with 5 ng/ml IL-1β for different time points. *P < 0.05, **P < 0.01 versus chondrocytes without IL-1β treatment. (E) Representative immunofluorescence images of SHP2 in articular cartilage in DMM and Sham mice, scale bar = 100 μm.

