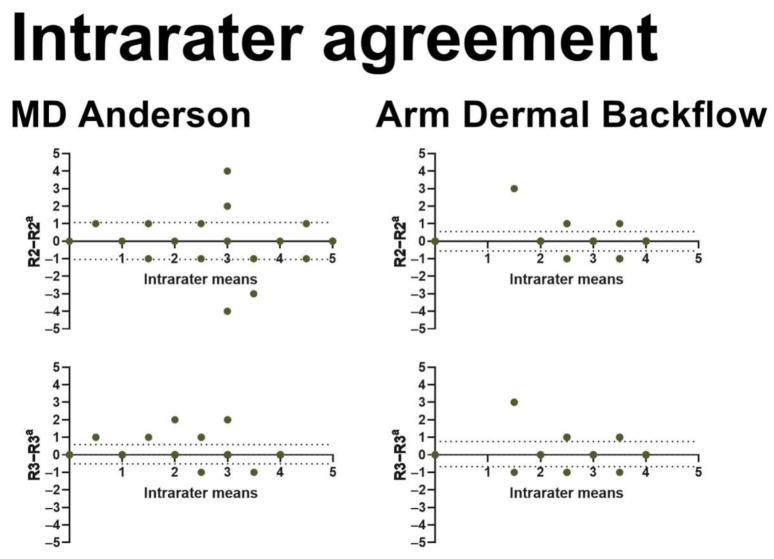
Figure 3.
This figure shows Bland–Altman plots for intrarater agreements in MDA and ADB scales. The x-axis represents the mean intrarater stage (range: 0–5). The y-axis shows the difference in intrarater staging (range: −5–5). The horizontal dotted lines denote the 95% confidence intervals for the limits of agreement. R2 = rater 2, R3 = rater 3. a = second assessment.

