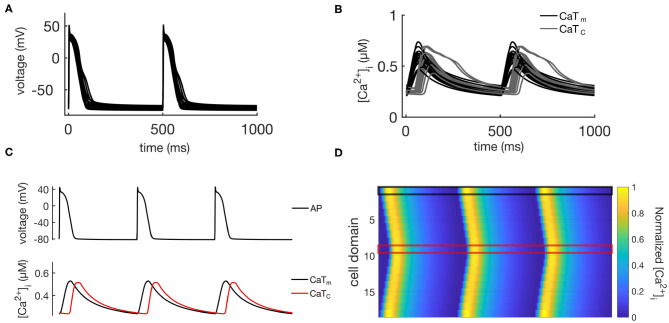
Figure 2.
Illustration of the behavior of the control population. (A) Shows APs for all 16 models, while the corresponding CaTs from the central and membrane domains are shown in (B). (C) Shows the same data for a single representative model, while (D) shows spatio-temporal plots of the calcium propagation for the same model.

